UNITED STATES
SECURITIES AND EXCHANGE COMMISSION
WASHINGTON, DC 20549
SCHEDULE 14A
(RULE 14a-101)
PROXY STATEMENT PURSUANT TO SECTION 14(a) OF THE SECURITIES
EXCHANGE ACT OF 1934
Filed by the Registrant ý
Filed by a Party other than the Registrant ¨
Check the appropriate box:
o Preliminary Proxy Statement
oConfidential, for Use of the Commission Only (as permitted by Rule 14a-6(e)(2))
ýDefinitive Proxy Statement
oDefinitive Additional Materials
oSoliciting Material Pursuant to Section 240.14a-12
| Whitestone REIT | ||
(Name of Registrant as Specified in Its Charter)
(Name of Person(s) Filing Proxy Statement, if other than the Registrant)
Payment of Filing Fee (Check the appropriate box):
ý No fee required.
o Fee computed on table below per Exchange Act Rules 14a-6(i)(l) and 0-11.
(1)Title of each class of securities to which transaction applies:
(2)Aggregate number of securities to which transaction applies:
(3)Per unit price or other underlying value of transaction computed pursuant to Exchange Act Rule 0-11 (Set forth the amount on which the filing fee is calculated and state how it was determined):
(4)Proposed maximum aggregate value of transaction:
(5)Total fee paid:
o Fee paid previously with preliminary materials.
o Check box if any part of the fee is offset as provided by Exchange Act Rule 0-11(a)(2) and identify the filing for which the offsetting fee was paid previously. Identify the previous filing by registration statement number, or the Form or Schedule and the date of its filing.
(1)Amount previously paid:
(2)Form, Schedule or Registration Statement No.:
(3)Filing Party:
(4)Date Filed:

2600 S. GESSNER ROAD, SUITE 500
HOUSTON, TEXAS 77063
April 3, 20202, 2021
Dear Shareholder:
You are cordially invited to attend the 20202021 Annual Meeting of Shareholders to be held on May 14, 2020,13, 2021, at 10:00a.m., Mountain StandardCentral Daylight Time. The Annual Meeting will be a virtual meeting conducted via live audio webcast that can be accessed by visiting www.virtualshareholdermeeting.com/WSR2020.WSR2021. During the virtual meeting, you may ask questions and will be able to vote your shares electronically. If there are any appropriate unanswered questions, we will address them on our corporate website as soon as practicable after the Annual Meeting. The virtual meeting has been designed to provide the same rights to participate as you would have at an in-person meeting.
The notice of Annual Meeting and proxy statement accompanying this letter provide an outline of the business to be conducted at the meeting. I will also report on our progress during the past year and answer shareholders' questions.
In accordance with the “e-proxy” rules promulgated by the Securities and Exchange Commission, we are pleased to take advantage of the practice of furnishing proxy materials to our shareholders over the internet. Accordingly, on or about April 3, 2020,2, 2021, we are mailing to our shareholders (other than those shareholders who have previously requested electronic or paper delivery) a Notice of Internet Availability of Proxy Materials. On the date of the mailing of the Notice of Internet Availability of Proxy Materials, all shareholders of record and beneficial owners will have the ability to access all of our proxy materials referred to in the Notice of Internet Availability of Proxy Materials on the internet website cited therein and in the accompanying Proxy Statement. These proxy materials will be available free of charge. The e-proxy rules afford us the opportunity not only to realize cost savings on the printing and distribution of our proxy materials but also to preserve our environment, and we hope that, if possible and convenient, you will avail yourself of this option.
It is important that your shares be represented at the Annual Meeting. I urge you to authorize a proxy to vote your shares via the internet, or by calling the toll-free telephone number, or by signing, dating and promptly returning your proxy card enclosed with the proxy materials. Your vote is important. If you have any questions about how to vote your shares, please call Kevin Reed, Whitestone's Director of Investor Relations, at 713-435-2219.
Sincerely yours,

James C. Mastandrea
Chairman and Chief Executive Officer
2600 S. GESSNER ROAD, SUITE 500
HOUSTON, TEXAS 77063
NOTICE OF ANNUAL MEETING OF SHAREHOLDERS
To be Held May 14, 202013, 2021
To ourOur Shareholders:
You are invited to attend our 20202021 Annual Meeting of Shareholders (the “Annual Meeting”), to be held on May 14, 202013, 2021, at 10:00 a.m. Mountain Standard00a.m., Central Daylight Time. The Annual Meeting will be a virtual meeting conducted via live audio webcast that can be accessed by visiting www.virtualshareholdermeeting.com/WSR2020.WSR2021. During the virtual meeting, you may ask questions and will be able to vote your shares electronically. If there are any appropriate unanswered questions, we will address them on our corporate website as soon as practicable after the Annual Meeting. The virtual meeting has been designed to provide the same rights to participate as you would have at an in-person meeting.
At the meeting, our shareholders will consider the following items of business:
1.To elect four trustees to serve until our 2022 annual meeting of shareholders and until their successors have been duly elected and qualified (Proposal No. 1);
2.To approve, in an advisory (non-binding) vote, the compensation of our named executive officers (Proposal No. 2);
3.To ratify the appointment of Pannell Kerr Forster of Texas, P.C. as our independent registered public accounting firm for the fiscal year ending December 31, 2021 (Proposal No. 3); and
4.To transact such other business that may properly come before the meeting or any adjournment or postponement thereof.
All shareholders of record as of the close of business on February 18, 202016, 2021 are entitled to notice of and to vote at the Annual Meeting or any adjournment or postponement thereof.
We are pleased to take advantage of the Securities and Exchange Commission rules that allow issuers to furnish proxy materials to their shareholders electronically. We believe these rules allow us to provide our shareholders with the information they need, while reducing the environmental impact of the Annual Meeting and lowering the costs of delivery of the materials.
OUR BOARD OF TRUSTEES RECOMMENDS THAT YOU VOTE FOR THE TRUSTEE NOMINEE,NOMINEES, FOR THE APPROVAL OF THE ADVISORY NON-BINDING VOTE REGARDING THE COMPENSATION OF OUR NAMED EXECUTIVE OFFICERS AND FORTHE RATIFICATION OF OUR INDEPENDENT REGISTERED PUBLIC ACCOUNTING FIRM.
REGARDLESS OF WHETHER YOU PLAN TO ATTEND THE ANNUAL MEETING, PLEASE READ THE PROXY STATEMENT AND AUTHORIZE A PROXY TO VOTE YOUR SHARES AS SOON AS POSSIBLE.
By order of the Board of Trustees,

John J. Dee
Chief Operating Officer and Corporate Secretary
i
April 3, 20202, 2021
IMPORTANT NOTICE REGARDING THE AVAILABILITY OF PROXY MATERIALS FOR THE ANNUAL MEETING TO BE HELD ON MAY 14, 2020:
13, 2021:
This Proxy Statement and Whitestone’s Annual Report to Shareholders for the fiscal year ended December 31, 20192020 are available for review by shareholders of record at: www.proxyvote.com
ii
iv
PROXY SUMMARY
Here we present an overview of information that you will find throughout this Proxy Statement. As this is only a summary, we encourage you to read the entire Proxy Statement for more information about these topics prior to voting.
| Annual Meeting of Shareholders | Shareholder Voting Matters | ||||||||||||||||
| Time and Date: | May | Proposals | Page | ||||||||||||||
| Place: | Virtual Meeting at www.virtualshareholdermeeting.com/ | 1. Election of | FOR | ||||||||||||||
| Record Date: | February | 2. Advisory vote on Executive Compensation | FOR | ||||||||||||||
| This | 3. Ratification of the appointment of Pannell Kerr Forster of Texas, P.C. as our independent registered public accounting firm for the fiscal year ending December 31, | FOR | |||||||||||||||
Our Trustees and NomineeNominees
You are being asked to vote on the election of onefour trustee nomineenominees listed below. Detailed information about theeach trustee nominee’s background, skills and expertise can be found in the Proposal No. 1 - Election of TrusteeTrustees section of this Proxy Statement. The Board has determined that suchthree of the four trustee nominee isnominees are independent. If the trustee nominee isnominees are elected at the Annual Meeting, the trustees shall hold committee memberships as follows:
| Committee Memberships | |||||||||||||||||
| Name and Primary Occupation | Age | Trustee Since | Audit | Compensation | Nominating and Corporate Governance Committee | ||||||||||||
| Nominees: | |||||||||||||||||
| Nandita V. Berry, former 109th Texas Secretary of State | 52 | 2017 | X | X | |||||||||||||
| Jeffrey A. Jones, Managing Director of Stephens Inc. | 65 | 2020 | © $ | X | |||||||||||||
| Jack L. Mahaffey, former Chief Executive Officer of Shell Mining Company | 89 | 2000 | X | © | |||||||||||||
| James C. Mastandrea, Chairman and Chief Executive Officer of Whitestone REIT | 77 | 2006 | |||||||||||||||
| Other Trustees: | |||||||||||||||||
| Paul T. Lambert, Chief Executive Officer of Lambert Capital Corporation | 68 | 2013 | X | © | |||||||||||||
| David F. Taylor, Chair of Locke Lord LLP | 57 | 2017 | X | X | |||||||||||||
X Member © Committee Chair $ Financial Expert | |||||||||||||||||
| Committee Memberships | |||||
| Name and Primary Occupation | Age | Trustee Since | Audit | Compensation | Nominating and Corporate Governance Committee |
| Nominee: | |||||
| Jeffrey A. Jones, Managing Director of Stephens, Inc. | 64 | 2020 | © $ | X | |
| Other Trustees: | |||||
| James C. Mastandrea, Chairman and Chief Executive Officer of Whitestone REIT | 76 | 2006 | |||
| Nandita V. Berry, former 109th Texas Secretary of State | 51 | 2017 | X | X | |
| Paul T. Lambert, Chief Executive Officer of Lambert Capital Corporation | 67 | 2013 | X | © | |
| Jack L. Mahaffey, former Chief Executive Officer of Shell Mining Company | 88 | 2000 | X | © | |
| David F. Taylor, Chair of Locke Lord LLP. | 56 | 2017 | X | X | |
X Member © Committee Chair $ Financial Expert | |||||
1
Our Commitment to Excellence in Shareholder Value
Our combination of strategic advantages has resulted in consistent execution of our strategy. This is evidenced by our total shareholder return (“TSR”), which has outpaced the average of our property-focused peers over the previous three and five year periodsfive-year period ended December 31, 2019.2020.
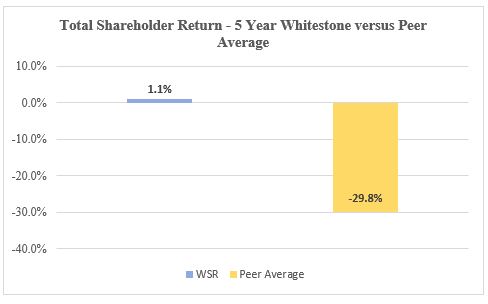
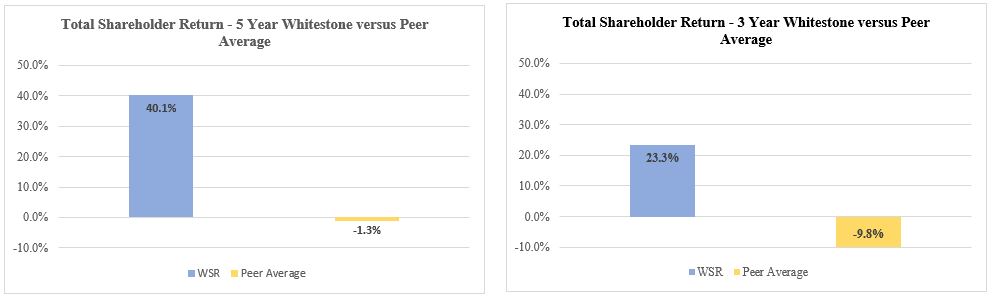
Our property-focused peers are Acadia Realty Trust, Brixmor Property Group Inc., Cedar Realty Trust Inc., Federal Realty Investment Trust, Kimco Realty Corp., Kite Realty Group Trust, RPT Realty, Regency Centers Corp., Retail Opportunity Investments Corp., Retail Properties of America, Inc., Retail Value, Inc., Saul Centers Inc., Site Centers Corp, Urban Edge Properties, Urstadt Biddle Properties Inc.,Inc.and Weingarten Realty Investors, and Wheeler REIT Inc.Investors. Source: S&P Global Market Intelligence.
Our Commitment to Excellence in Performance
The COVID-19 pandemic has had a profound effect on the lives of people around the world. The threat of the disease, related casualties and governmental imposed restrictions on daily life have forced us to quickly adopt different ways of working, learning and connecting with each other.
While this crisis has brought unprecedented challenges both for individuals and society at large, we have been humbled by the wave of inspiring new ideas developed in response. Innovation is more important now than ever before. From neighborly acts of kindness to tracking important data, the last few months have shone a light on the power of human creativity and collaboration.
In March 2020, as the global economy started to unravel, we shifted from our standard operating plan to a crisis management plan. While 75% of our employees worked from home during 2020, our senior management team was in the office daily. We quickly implemented the following actions:
•Engaged with all tenants to help them operate their businesses safely and access available financial resources
•Stopped all cash out-flows for development and re-development projects
•Halted pending acquisitions
•Froze salary increases for the second year for
•Applied a reduction in workforce
•Temporarily drew down the available funds from our Companyline of credit
•Reduced our dividend
•Reviewed our cash position daily
•Held daily virtual meetings, which were hosted by leaders at every level with their respective teams, and weekly CEO-hosted virtual town halls to provide employees with company-wide updates.
•Provided ongoing communication with stakeholders to keep them fully informed of our ongoing progress as we continued our positive momentum in each key facetnavigated the economic response to the pandemic
2
As the year progressed, and through the outstanding efforts of our business. The combinationcommitted team, we have been able to perform even under the toughest of accomplishments included:circumstances. Highlights of our 2020 performance include:
| Period | Whitestone | Shopping Center Peer Average (1) | ||||||
| Q2 2020 | 81% | 73% | ||||||
| Q3 2020 | 90% | 88% | ||||||
| Q4 2020 | 95% | 93% | ||||||
| January, 2021 | 96% | |||||||
(1) Source: Public filings for Acadia Realty Trust, Brixmor Property Group Inc., Cedar Realty Trust Inc., Federal Realty Investment Trust, Kimco Realty Corp., Kite Realty Group Trust, RPT Realty, Regency Centers Corp., Retail Opportunity Investments Corp., Retail Properties of America, Inc., Retail Value, Inc., Saul Centers Inc., Site Centers Corp, Urban Edge Properties, Urstadt Biddle Properties Inc.and Weingarten Realty Investors.
•Solid Tenant Leasing. Our square foot leasing activity was 10% higher in the fourth quarter of 2020 than the fourth quarter of 2019 and our blended leasing spreads on new and renewal leases, on a GAAP basis, were a positive 8.9% for the year.
•Stable Occupancy. Despite having a significant amount of our tenant businesses severely impacted, we only had a handful of tenants close permanently such that the portfolio occupancy rate held up well, ending the year at 88.2%, down 2.1%, or approximately 100,000 less leased square feet representing the net loss of only 9 tenants year over year.
•Foot Traffic Recovery.We believe that one of the most encouraging signs and a good harbinger of things to come is the significant foot traffic we are seeing at our properties. A December 2020 article by S&P Global highlighted Whitestone’s #1 Ranking for the Shopping Center Industry in foot traffic recovery on Black Friday, with an 81% year-over-year recovery. This far outpaced the industry average of only 48%. It also supported and confirmed our own internal research using third party AI software that showed over 80% year-over-year recovery at our properties for the entire month of November.
•Uninterrupted Monthly Dividends. As one of the few monthly dividend paying public REITs, we were conscientious of the importance of the monthly dividend to our shareholders. Albeit at a reduced rate during 2020, we continued with a monthly dividend while many others suspended distributions. With the strength, stability, and predictability of our cash flows, we continued the uninterrupted payouts for 127 consecutive months to date since our IPO.
•Lowering Debt Leverage. Reduction of our total net debt, defined as outstanding debt plus pro rata share of outstanding debt of real estate partnership less cash and pro rata share of cash of real estate partnership, by $12.0 million, or 2% from the prior year.
2020 Full Year Operating and Financial Highlights
All per share foramounts are on a diluted per common share and operating partnership (“OP”) unit basis unless stated otherwise. Included in fourth quarter and full year 2019net income attributable to Whitestone REITcommon shareholders and funds from operations is a $1.7 million gain from PPP Loan forgiveness.
•Net Income attributable to common shareholders of $0.57$0.14 per diluted share
•Funds from operationsOperations (“FFO”), as defined by the National Association of Real Estate Investment Trusts ("NAREIT"(“NAREIT”), for full year 2019was $0.83 per share
•FFO Core was $0.93 per share
•Comparable GAAP-based leasing spreads of $0.90 per share8.9%
•Bad debt/uncollectible revenue was $6.9 million, or $0.16 per share, primarily due to COVID-19 pandemic and included $1.2 million of 2.4%non-cash straight-line rent
3
COVID-19 Update Summary (as of February 23, 2021)
•All 53 community centers are open and have remained open throughout the pandemic
•99% of tenants are open and operating (based on ABR)
•95% of fourth quarter 2020 contractual rents have been collected
•96% of total January contractual rents have been collected to date
•Entered into rent deferral agreements representing 3% of fourth quarter 2020 revenue
•Grew cash and cash equivalents by $10.2 million in 2020 from the prior year
NOI, FFO and FFO Core are financial measures that are not calculated pursuant to U.S. generally accepted accounting principles (“GAAP”GAAP”). Please refer to APPENDEXAPPENDIX A - NON-GAAP MEASURES for explanations and reconciliations of these metrics to their most comparable GAAP metric.
Our Commitment to Excellence in Stakeholder Engagement
Through owing, operating, developing and redeveloping successful neighborhood community shopping centers, we engage with a wide variety of stakeholders, including shareholders, bondholders, lenders, employees, co-investment partnerships, tenants, and the local communities where our properties are located. Considering the needs and feedback of these stakeholders is crucial to the value-creation process as they are in a position to significantly influence our long-term success.
| STAKEHOLDER GROUP | ENGAGEMENT APPROACH | TOPICS OF DISCUSSION | |||||||||
| Shareholders, Bondholders and Lenders | ● | ● Interactions facilitated via industry associations and sell-side analyst conferences | ● Company goals and strategic objectives, performance and expectations, transparent disclosure, corporate governance and other ESG initiatives | ||||||||
| ● Direct dialogue through Whitestone-hosted market visits and quarterly conference calls | ● Information sharing via company filings | ||||||||||
| Tenants | ● Tenant site visits on a regular basis performed by property managers and regional managers | ● | ● Tenant performance, tenant satisfaction, property maintenance, property health and safety, property efficiencies, COVID-19 financial resources and sustainable building practices | ||||||||
| Communities | ● | ● Direct dialogue through open houses and town halls | ● Property specific information, community interests and needs | ||||||||
| ● Monitoring through social media | |||||||||||
| Vendors | |||||||||||
| Employees | ● | ● Special project and training workshops | ● Employee satisfaction, benefits and compensation, health and safety, career development and training, diversity and equal opportunity | ||||||||
| ● Employee review meetings and Q&A sessions with the executive team members | ● Open door policy that encourages employees to offer opinions or raise concerns informally | ||||||||||
| ● Formal reporting mechanism to raise issues such as fraud, harassment, etc. | |||||||||||
Our approach to stakeholder engagement is described in detail in our inaugural Corporate Responsibility Report posted on our website at www.whitestonereit.com
4
Our Commitment to Excellence in Corporate Responsibility
We own, operate, develop and redevelop retail community-centered properties in vibrant markets and create value by leasing, managing, developing, and redeveloping properties to be a place of connection and convenience, crafted for the local needs of the community.
We are more than landlords - we build unity and synergy between our tenants, designing a tenant mix for cross-referral business, which is the glue that creates the community atmosphere within our properties. In doing so, we create value for the community and other stakeholders.
We understand that managing our environmental, social and governance ("ESG") responsibilities is critical to creating and sustaining long-term value. Our priorities in those efforts are providing sustainable, high quality rental spaces with credit-worthy tenants; investing in our people to ensure we can attract and retain the talent we need to remain successful; and operating to the highest possible standards of ethics and transparency.
| Social Responsibility | ||
| Our Employees: | ||
Internship Program | ||
5
| Social Responsibility | ||
| Our | ||
Lease to tenants that provide beneficial services to the surrounding communities | ||
Participation of associates in volunteering and philanthropy | ||
| Ethics and Governance | ||
| Environmental Stewardship | ||
| Redeveloping and Revitalizing | ||
Looking forward, Whitestone plans to evaluate the possibility of Energy Star and LEED certifications for select properties, as well as voluntarily participate in GRESB assessments and CDP disclosure in the future. | ||
Our approach to corporate responsibility and key environmental, social, and governance initiatives are described in detail in our Corporate Responsibility and Sustainability Report on our websitehttp://ir.whitestonereit.com/ under the Corporate Responsibility section.
6
Our Commitment to Excellence in Corporate Governance
Board Refreshment and Characteristics of Board Members
We believe that, while the Company can benefit from experienced trustees, periodic refreshment of the Board is important. We understand that the quality, dedication and chemistry of the Whitestone REIT Board of Trustees (our "Board") have been integral to the Company’s success. Since 2017, and assuming the election of the trustee nominee at the Annual Meeting, we will have achieved a significant refreshment of our Board, reflecting a balanced set of experienced boardBoard members and less tenured trustees who bring fresh perspectives and differing backgrounds, as follows:
| Tenure | Independence | |||||||||||||||||||
| Under 5 Years | 3 | 50 | % | Independent | 5 | 83 | % | |||||||||||||
| 5 to 10 Years | 1 | 17 | % | Non-independent | 1 | 17 | % | |||||||||||||
| Over 10 Years | 2 | 33 | % | |||||||||||||||||
| Average Tenure | 8 | |||||||||||||||||||
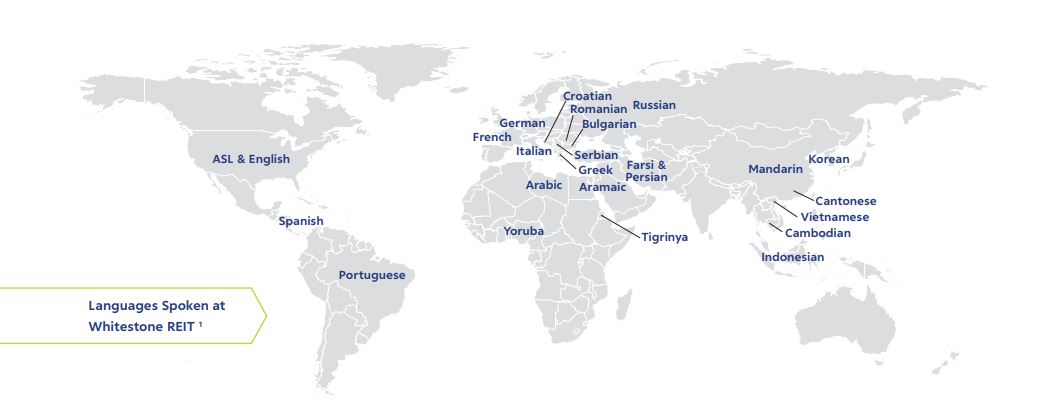
Diversity is an important strategic initiative at Whitestone and has relevance to our associates, suppliers, and shareholders. We also are committed to diversity at the Board level. Having a Board composed of men, women, and people of color with different perspectives facilitates more balanced, wide-ranging discussion in the boardroom. The Board also is committed to inclusion-ensuring that all trustees has decreased from 70 in 2019feel welcomed, valued, and able to 67 in 2020contribute their opinions.
•One of our current six trustees has decreased from eight years to seven yearsis a female and a person of color.
| Gender Diversity | Ethnic Diversity | |||||||||||||||||||
| Women | 1 | 17 | % | People of Color | 1 | 17 | % | |||||||||||||
| Men | 5 | 83 | % | White | 5 | 83 | % | |||||||||||||
| Gender Diversity | Independence | |||||||||
| Women | 1 | 17 | % | Independent | 5 | 83 | % | |||
| Men | 5 | 83 | % | Non-independent | 1 | 17 | % | |||
| Tenure | Age | |||||||||
| Under 5 Years | 3 | 50 | % | Under 55 | 1 | 17 | % | |||
| 5 to 10 Years | 1 | 17 | % | 55 - 60 | 1 | 17 | % | |||
| Over 10 Years | 2 | 33 | % | Over 60 | 4 | 67 | % | |||
| Average Tenure | 7 | Average Age | 67 | |||||||
Skills of Board Members
Each of our Board members possess one or more of the skills listed below:
| Strategy | Real Estate | Financial | ||||||||||||
| Leadership | ||
7
| Investments | Corporate Governance | |||||||
Corporate Governance Highlights
| Key Attributes | ||
Plurality with Majority Resignation Standard in Trustee Elections | ||
8
SOLICITATION AND VOTING
The Board, on behalf of the Company, is soliciting proxies to be used at our Annual Meeting to be held on May 14, 202013, 2021 at 10:00 a.m., Mountain StandardCentral Daylight Time.
How may I attend the virtual Annual Meeting?
The Annual Meeting will be a virtual meeting conducted viaby live audio webcast that can be accessed by visiting www.virtualshareholdermeeting.com/WSR2020,WSR2021, or at any postponement or adjournment thereof.
If you plan to attend the Annual Meeting online, you will need the 16-digit control number included in your Notice of Internet Availability of Proxy Materials, on your Proxy Card or on the instructions that accompany your Proxy Materials. The Annual Meeting will begin promptly at 10:00 a.m., Mountain StandardCentral Daylight Time. Online check-in will begin at 9:45 a.m, Mountain Standarda.m., Central Daylight Time, and you should allow ample time for the online check-in procedures.
What proposals will be voted upon at the Annual Meeting?
The following proposals are scheduled to be voted upon at the Annual Meeting: (1) the election of one trusteefour trustees to serve until our 20212022 annual meeting of shareholders and until his successor hastheir successors have been duly elected and qualified; (2) the approval of, in an advisory (non-binding) vote, the compensation of our named executive officers,officers; and (3) the ratification of the appointment of Pannell Kerr Forster of Texas, P.C. as our independent registered public accounting firm for the fiscal year ending December 31, 2020.2021. As of the date of this Proxy Statement, we are not aware of any other matters that will be presented for consideration at the Annual Meeting.
Who is entitled to vote at the Annual Meeting?
Only holders of record of our common shares as of the close of business on the record date, February 18, 2020,16, 2021, are entitled to receive notice of and to vote at the Annual Meeting or any postponement or adjournment thereof. As of the close of business on February 18, 2020,16, 2021, we had 42,046,73242,478,720 common shares outstanding. Common shareholders are entitled to one vote for each common share that they owned on the record date.
Shareholder of Record: Shares Registered in Your Name. If, on February 18, 2020,16, 2021, your shares were registered directly in your name with Whitestone's transfer agent, American Stock Transfer & Trust Company, LLC, then you are a shareholder of record. As a shareholder of record, you may vote in person (virtually) at the Annual Meeting by visiting www.virtualshareholdermeeting.com/WSR2020,WSR2021, which provides rights and opportunities to vote and ask questions equivalent to in-person meetings of shareholders, or authorize a proxy to vote your shares as set forth below.
Beneficial Owner: Shares Registered in the Name of a Broker, Bank or Other Agent. If, on February 18, 2020,16, 2021, your shares were held in an account with a broker, bank or other agent, then you are the beneficial owner of shares held in “street name,” and a voting instruction form was forwarded to you by that organization. The organization holding your account is considered to be the shareholder of record for purposes of voting at the Annual Meeting. As a beneficial owner, you have the right to direct your broker, bank or other agent how to vote the shares in your account. You are also invited to attend the Annual Meeting viaby live audio webcast that can be accessed by visiting www.virtualshareholdermeeting.com/WSR2020.WSR2021. However, because you are not the shareholder of record, you may not vote your shares in person (virtually) at the Annual Meeting unless you request and obtain a “legal proxy” from your broker, bank or other agent.
Why did I not automatically receive a paper copy of the Proxy Statement, Proxy Card and Annual Report?
The Securities and Exchange Commission (“SEC”) rules allow us to furnish proxy materials to our shareholders electronically. By utilizing electronic delivery, we protect the environment by reducing our use of paper and lower the costs of delivery of proxy materials. We only mail proxy materials to those shareholders who specifically request a paper copy. On or about April 3, 2020,2, 2021, we mailed to all shareholders a Notice of Internet Availability of Proxy Materials that contained an overview of the proxy materials and explained several methods by which shareholders could view the proxy materials online or request a printed copy of the proxy materials to be delivered via regular mail or e-mail. There is no charge for requesting a printed copy. The Notice of Internet Availability of Proxy Materials includes a website address that provides you with instructions on how to view our proxy materials on the internet and enables you to notify us to send proxy materials to you viaby e-mail.
9
Can I find additional information on the Company website?
Yes. Our website is www.whitestonereit.com. Although the information contained on our website is not and should not be considered part of this Proxy Statement, you can view additional information on the website, such as our Code of Business Conduct and Ethics, Corporate Governance Guidelines, charters of Board committees, and filings with the SEC. A copy of any of these documents may be obtained free of charge by writing to Whitestone REIT, 2600 South Gessner Road, Suite 500, Houston, Texas 77063, Attention: Investor Relations.
How do I vote?
You may either vote for or withhold your vote on the election of the trustee nomineenominees and you may vote for, against, or abstain from voting on the other proposals. The procedures for voting are set forth below.
Shareholder of Record: Shares Registered in Your Name. If you are a shareholder of record, you may vote in person (virtually) at the Annual Meeting by visiting www.virtualshareholdermeeting.com/WSR2020,WSR2021, which provides rights and opportunities to vote and ask questions equivalent to in-person meetings of shareholders. You may also vote by giving your proxy authorization over the internet or by telephone or mail. Proxies validly delivered by shareholders (by internet, telephone or mail as described below) and timely received by us will be voted in accordance with the instructions contained therein. Whether or not you plan to attend the Annual Meeting, we encourage you to submit a proxy card or to give your proxy authorization to ensure that your votes are counted. You may still attend the Annual Meeting and vote in person (virtually) if you have already voted by submitting a proxy card or given your proxy authorization.
If a shareholder signs and returns a proxy card but gives no instructions, the shareholder's shares will be voted in accordance with the recommendations of our Board with respect to all Proposals.
You may authorize a proxy in three ways:
•Vote online. You can authorize a proxy to vote your shares online by following the instructions on the proxy card.
•Vote by telephone. You also have the option to authorize a proxy to vote your shares by telephone by following the instructions provided on the proxy card; andcard.
•Vote by regular mail. If you would like to authorize a proxy to vote your shares by mail, then please mark, sign and date the proxy card and return it promptly in the postage-paid envelope provided.
The individuals named as proxies on the proxy card to vote your shares also have the discretionary authority to vote your shares, to the extent permitted by Rule 14a-4(c) under the Securities Exchange Act of 1934, as amended (the “Exchange Act”), on any matter that is properly brought before the Annual Meeting. The following proposals are scheduled to be voted upon at the Annual Meeting: (1) the election of one trusteefour trustees to serve until our 20212022 annual meeting of shareholders or until his successor hastheir successors have been duly elected and qualified; (2) the approval, in an advisory (non-binding) vote, of the compensation of our named executive officers; and (3) the ratification of the appointment of Pannell Kerr Forster of Texas, P.C. as our independent registered public accounting firm for the fiscal year ending December 31, 2020.2021. As of the date of the Notice of Annual Meeting of Shareholders, we knew of no other matters to be presented at the Annual Meeting.
Beneficial Owner: Shares Registered in the Name of a Broker, Bank or Other Agent. If you are a beneficial owner of shares registered in the name of your broker, bank or other agent, you should have received the voting instruction form from that organization rather than from Whitestone. You should follow the instructions provided by your broker, bank or other agent regarding how to vote your shares. As the holder of record, only your bank, broker, other institution or nominee is authorized to vote or grant a proxy for your shares. Accordingly, if you wish to vote your shares in person (virtually), you must contact your bank, broker or other holder of record to obtain a “legal proxy” granting you the authority to do so. When you properly vote in accordance with the instructions provided in the voting instruction form, you are giving your bank, broker or other holder of record instructions on how to vote the shares they hold for you.
Regardless of how you choose to vote, your vote is important to us and we encourage you to vote promptly.
Can I change or revoke my vote after I return my proxy card?
Yes. If you are the shareholder of record of your shares, you may change or revoke your proxy at any time before it is exercised in one of three ways:
•You may send another properly completed proxy card bearing a later date, or submit a later-dated proxy by telephone or viaby the internet, in a timely manner;
•You may deliver a written notice of revocation, which must be received prior to or at the Annual Meeting, to our Chief Operating Officer and Corporate Secretary, John J. Dee, at Whitestone REIT, 2600 South Gessner Road, Suite 500, Houston, Texas 77063; or
•You may attend the Annual Meeting virtually viaby live audio webcast that can be accessed by visiting www.virtualshareholdermeeting.com/WSR2021,www.virtualshareholdermeeting.com/WSR2020, which provides rights and opportunities to revoke your proxy at the Annual Meeting and vote in-person (virtually). However, your attendance at the Annual Meeting will not, by itself, revoke your proxy.
If your shares are held by your broker, bank or other agent as your nominee, you should follow the instructions provided by your broker, bank or other agent.
How many shares must be present to constitute a quorum for the Annual Meeting?
A quorum of shareholders is necessary to hold a valid meeting. A quorum will be present if the holders of at least a majority of the outstanding shares entitled to vote are represented in person (virtually) or by proxy at the Annual Meeting. As of the close of business on February 18, 2020,16, 2021, the record date, there were 42,046,73242,478,720 common shares outstanding and entitled to vote. Thus, 21,023,36721,239,361 common shares must be represented in person (virtually) or by proxy at the Annual Meeting to constitute a quorum.
Your shares will be counted towards the quorum if you vote in person (virtually) at the Annual Meeting or if you submit a valid proxy by mail, internet or telephone (or one is submitted on your behalf by your broker, bank or other agent). Additionally, “WITHHOLD” votes, abstentions and broker non-votes, as described below, will also be counted towards the quorum requirement. If there is no quorum, the chairman of the Annual Meeting may adjourn the meeting until a later date.
What are the recommendations of the Board?
Our Board unanimously recommends you submit your voting instructions using the enclosed proxy card as follows:
1.Our Board unanimously recommends a vote “FOR” the election of the four trustee nominees nominated by the Board. 2.Our Board unanimously recommends a vote “FOR” the approval, in an advisory (non-binding) vote, of the compensation of our named executive officers. 3.Our Board unanimously recommends a vote “FOR” the ratification of the appointment of Pannell Kerr Forster of Texas, P.C. as our independent registered public accounting firm for the fiscal year ending December 31, 2021. |
How are votes counted?
Votes will be counted by the inspector of election appointed for the Annual Meeting, who will separately count (i) “FOR” and “WITHHOLD” votes and broker non-votes with respect to Proposal No. 1 (election of trustee)trustees), (ii) “FOR,” “AGAINST” and “ABSTAIN” votes and broker non-votes with respect to Proposal No. 2 (advisory vote on executive compensation) and (iii) “FOR”, “AGAINST” and “ABSTAIN” votes with respect to Proposal No. 3 (ratification of our independent registered public accounting firm).
Abstentions and broker non-votes will be treated as shares present for the purpose of determining a quorum for the transaction of business at the Annual Meeting. A broker non-vote occurs when a nominee, such as a broker, bank or other agent, holding shares for a beneficial owner does not vote on a particular proposal because the nominee does not have discretionary authority with respect to that proposal and has not received instructions with respect to that proposal from the
beneficial owner. Brokers, banks or other agents that have not received voting instructions from their clients cannot vote on their clients' behalf with respect to “non-routine” proposals but may vote their clients' shares on “routine” proposals.
11
Under applicable rules of the New York Stock Exchange (the “NYSE”), Proposal No. 1 (election of trustee)trustees) and Proposal No. 2 (advisory non-binding vote on executive compensation) are non-routine matters and a broker, bank or other agent does not have discretionary authority to vote on such proposals. Conversely, Proposal No. 3 (ratification of the appointment of our independent registered public accounting firm) is a routine matter and brokers, banks or other agents have discretionary authority to vote on such proposal.
How many votes are needed to approve each proposal?
•For each of the trustee nomineenominees to be elected (Proposal No. 1), such nominee must receive the vote of a plurality of all the votes cast at the Annual Meeting, whether in person (virtually) or by proxy, in respect of his or her election. This means the nomineenominees receiving the greatest number of “FOR” votes will be elected. Broker non-votes and abstentions will have no impact as they are not counted as votes cast for this purpose, although they will be considered present for the purpose of determining a quorum. In addition, our Corporate Governance Guidelines provide that any nominee for trustee in an uncontested election who receives a greater number of votes “WITHHELD” from his or her election than votes “FOR” such election shall tender his or her resignation for consideration by the Nominating and Corporate Governance Committee, which shall then make a recommendation to the Board, after which the Board will publicly disclose its decision with respect to such resignation within 90 days of the certification of the election results.
•For the advisory vote on executive compensation (Proposal No. 2) to be approved, the proposal must receive the affirmative vote of a majority of all votes cast at the Annual Meeting, whether in person (virtually) or by proxy (which means the votes cast “FOR” the proposal must exceed the votes cast “AGAINST” the proposal). For purposes of this advisory vote, abstentions and broker non-votes will not be counted as votes cast and will have no effect on the result of the vote, although they will be considered present for the purpose of determining a quorum.
•For the ratification of the appointment of our independent registered public accounting firm (Proposal No. 3) to be approved, the proposal must receive the affirmative vote of a majority of all votes cast at the Annual Meeting, whether in person (virtually) or by proxy (which means the number of votes cast “FOR” the proposal must exceed the number of votes cast “AGAINST” the proposal). In determining whether Proposal No. 3 has received the requisite number of affirmative votes, abstentions will not be counted as votes cast and will have no impact, although they will be considered present for the purpose of determining a quorum.
May I ask questions at the Annual Meeting?
You may ask questions virtually during the Annual Meeting. You may also submit questions in advance by visiting www.virtualshareholdermeeting.com/WSR2020.WSR2021.
Who is paying for this proxy solicitation?
We will pay for the entire cost of our solicitation of proxies. In addition to the costs of mailing the paper or electronic copies of our proxy materials, our officers or employees may also solicit proxies by telephone, e-mail or personal interview. Officers and employees will not be paid any additional compensation for soliciting proxies. We may also reimburse brokers, banks and other agents for the cost of forwarding proxy materials to beneficial owners.
Any proxy given pursuant to this solicitation may be revoked by notice from the person giving the proxy at any time before it is exercised. Any such notice of revocation should be provided in writing signed by the shareholder in the same manner as the proxy being revoked and delivered to our Corporate Secretary at Whitestone REIT, 2600 South Gessner Road, Suite 500, Houston, Texas 77063.
How many copies should I receive if I share an address with another shareholder?
The SEC has adopted rules that permit companies and intermediaries, such as brokers, banks or other agents, to implement a delivery procedure called “householding.” Under this procedure, multiple shareholders who reside at the same address may receive a single copy of our proxy materials, including the Notice of Internet Availability of Proxy Materials, unless the affected shareholder has provided us with contrary instructions. This procedure provides extra convenience for shareholders and cost savings for companies.
Whitestone and some brokers, banks or other agents may be householding our proxy materials, including the Notice of Internet Availability of Proxy Materials. A single Notice of Internet Availability of Proxy Materials and, if applicable, a single set of the Annual Report and other proxy materials will be delivered to multiple shareholders sharing an address unless contrary
12
instructions have been received from the affected shareholders. Once you have received notice from your broker, bank or other agent that it will be householding communications to your address, householding will continue until you are notified otherwise or until you revoke your consent. If you did not respond that you did not want to participate in householding, you were deemed to have consented to the process. Shareholders may revoke their consent at any time by contacting Broadridge ICS, either by calling toll-free (866) 540-7095 or by writing to Broadridge Householding Department, 51 Mercedes Way, Edgewood, NY, 11717.
Upon written or oral request, Whitestone will promptly deliver a separate copy of the Notice of Internet Availability of Proxy Materials and, if applicable, the Annual Report and other proxy materials, to any shareholder at a shared address to which a single copy of any of those documents was delivered. To receive a separate copy of the Notice of Internet Availability of Proxy Materials and, if applicable, the Annual Report and other proxy materials, you may send a request to Whitestone, either in writing or telephone, at the address or telephone number listed under “Whom should I contact if I have any questions?” below. Requests must be received by April 25, 202024, 2021 for materials to be received prior to the Annual Meeting. In addition, if you are receiving multiple copies of the Notice of Internet Availability of Proxy Materials and, if applicable, Annual Report and other proxy materials, you can request householding by contacting our Investor Relations department in the same manner.
How can I obtain Whitestone’s Annual Report?
Our Annual Report, as filed with the SEC, can be accessed, along with this Proxy Statement, by following the instructions contained in our Notice of Internet Availability of Proxy Materials and is also available on the Investor Relations page of our corporate website at www.whitestonereit.com. If you wish to receive a copy of our Annual Report, as well as a copy of any exhibit specifically requested, we will mail these documents to you free of charge. Requests should be sent to Whitestone REIT, 2600 South Gessner Road, Suite 500, Houston, Texas 77063, Attention: Investor Relations. A copy of our Annual Report has also been filed with the SEC and may be accessed from the SEC’s website at www.sec.gov.
The Annual Report is not, and should not be considered to be, a part of our proxy materials.
How can I find out the results of the voting at the Annual Meeting?
Preliminary voting results will be announced at the Annual Meeting. Final results will be announced in a Current Report on Form 8-K that will be filed with the SEC within four business days after the conclusion of the Annual Meeting and may be accessed from the SEC’s website at www.sec.gov.
How and when may I submit a shareholder proposal for Whitestone’s 20212022 annual meeting of shareholders?
In order for a shareholder proposal submitted pursuant to Rule 14a-8, promulgated under the Exchange Act, to be considered for inclusion in the proxy statement for our 20212022 annual meeting of shareholders, written proposals must be received by the Corporate Secretary at Whitestone REIT, 2600 South Gessner Road, Suite 500, Houston, Texas 77063, no later than December 4, 20203, 2021 and must comply with all applicable requirements of Rule 14a-8.
Pursuant to Whitestone's bylaws, shareholders wishing to submit proposals or trustee nominations, whether or not included in our proxy materials, must have given timely notice thereof in writing to our Corporate Secretary. Under our current bylaws, to be timely for our 20212022 annual meeting of shareholders, you must deliver proposals or nominations to our Corporate Secretary, in writing, not later than 5:00 p.m. Central Time on January 4, 2021,2, 2022, nor earlier than December 4, 2020.3, 2021. We also advise you to review Whitestone’s bylaws, which contain additional requirements about advance notice of shareholder proposals and trustee nominations, including the different notice submission date requirements in the event that the date for our 20212022 annual meeting of shareholders is more than 30 days before or after May 14, 2021.13, 2022.
A more detailed discussion regarding the submission of proposals for the 20212022 annual meeting of shareholders is provided under “Corporate Governance - Shareholder Nominations for Trustee” below.
Whom should I contact if I have any questions?
If you have any questions about the Annual Meeting or these proxy materials, please contact Kevin Reed, Whitestone's Director of Investor Relations at 713-435-2219.
13
PROPOSAL NO. 1 - ELECTION OF TRUSTEETRUSTEES
Our Board consists of sevensix trustees, sixfive of whom are independent, and is currently divided into three classes. Each class consists, as nearly as possible, of one-third of the total number of trustees, and each class serves for a three-year term.
In 2019, we amended our Charter to provide that, commencing at the Company’s 2020 annual meeting of shareholders, the Trustees shall be elected as follows:
(i) at the 2020 annual meeting of shareholders, each Trustee who shall be elected to succeed a Trustee with a term expiring at the 2020 annual meeting of shareholders and upon the election and qualification of his or her successor shall be elected annually and shall serve until the next annual meeting of shareholders and until his or her successor is duly elected and qualifies;
(ii) at the 2021 annual meeting of shareholders, each Trustee who shall be elected to succeed a Trustee with a term expiring at the 2021 annual meeting of shareholders (including, for the avoidance of doubt, those Trustees elected at the 2020 annual meeting of shareholders) and upon the election and qualification of his or her successor shall be elected annually and shall serve until the next annual meeting of shareholders and until his or her successor is duly elected and qualifies; and
(iii) at and after the 2022 annual meeting of shareholders, the Trustees shall no longer be classified, with respect to the terms for which they severally hold office, and each Trustee (including, for the avoidance of doubt, those Trustees elected at the 2021 annual meeting of shareholders) shall be elected annually and shall serve until the next annual meeting of shareholders and until his or her successor is duly elected and qualifies.
Jack L. Mahaffey, James C. Mastandrea and Nandita V. Berry are our current Class III trustees and their terms expire at our 2021 annual meeting of shareholdersAnnual Meeting and upon the election and qualification of their successors.
Paul T. Lambert and David F. Taylor are our current Class I trustees and their terms expire at our 2022 annual meeting of shareholders and upon the election and qualification of their successors.
In addition, at the Board's request, Mr. Daniel G. DeVos, who served as trustee from 2009 to 2013, has served the Company as a trustee emeritus since 2013, allowing other trustees to continue to draw upon Mr. DeVos’s knowledge and experience in an advisory and non-voting capacity.
Trustees are elected by a plurality of all votes cast by the holders of shares present in person (virtually) or represented by proxy at the Annual Meeting. This means that the nomineenominees receiving the greatest number of “FOR” votes will be elected. In addition, our Corporate Governance Guidelines provide that any nominee for trustee in an uncontested election who receives a greater number of “WITHHOLD” votes from his or her election than votes “FOR” such election shall tender his or her resignation for consideration by the Nominating and Corporate Governance Committee, which shall then make a recommendation to the Board, after which the Board will publicly disclose its decision with respect to such resignation within 90 days of the certification of the election results.
Shares represented by valid proxies will be voted, if authority to do so is not withheld, for the election of Mr. Jones.Ms. Berry and Messrs. Jones, Mahaffey and Mastandrea. The Board has no reason to believe that Mr. Jonesany of the nominees will be unable to serve as trustee.trustees. In the event, however, that Mr. Jones
any of the nominees should be unavailable for election as a result of an unexpected occurrence, shares represented by valid proxies will be voted for the election of such substitute nomineenominees as the Nominating and Corporate Governance Committee may propose.
14
If elected at the Annual Meeting, Mr.Ms. Berry and Messrs. Jones, hasMahaffey and Mastandrea have agreed to serve until the 20212022 annual meeting of shareholders and until his successor istheir successors are duly elected and qualified, or until histheir earlier death, resignation or removal. Mr.Ms. Berry and Messrs. Jones, isMahaffey and Mastandrea are not being nominated for election pursuant to any agreements or understandings between us and any other person.
Our Board unanimously recommends that you vote “FOR” the election of trustees Nandita V. Berry, Jeffrey A. Jones.Jones, Jack L. Mahaffey and James C. Mastandrea..
15
Members of the Board of Trustees
Set forth below are descriptions of the backgrounds and principal occupations of the nominee for trustee included in Proposal No. 1 and for each of our trustees with terms expiring after the Annual Meeting, and the period during which each has served as a trustee.
| Trustee | Age(1) | Business Experience | Trustee Since | |||||||||||||||||
| Nominees | ||||||||||||||||||||
| Nandita V. Berry | 52 | Ms. Berry was formerly the 109th Texas Secretary of State from January 2014 to February 2015. She also previously served on the University of Houston System Board of Regents and held Senior Counsel positions at Locke Lord LLP and El Paso Energy Corporation. Ms. Berry began her legal career as an Associate at Haynes and Boone, LLP. Ms. Berry previously served on the Board of the Houston Zoo, Inc., the South Asian Chamber of Commerce and the Community Family Center of Houston. | 2017 | |||||||||||||||||
| Jeffrey A. Jones | 65 | Mr. Jones has over 35 years of experience as an investment banker and restructuring advisor. Since 2018, he has served as a Managing Director at Stephens Inc. From 2011 to 2018, he co-headed Blackhill Partners, an investment banking and restructuring firm, as its President and Partner. From 2015 through 2016, he also served as the Chief Restructuring Officer for Black Elk Energy. Mr. Jones has chaired audit committees, served on audit committees and been qualified as an expert in valuation, sale process and interest rates in federal courts in the northeast, including Delaware, the Midwest and southern U.S. He has lectured at several universities, including Northwestern University’s Kellogg School of Management and The University of Texas Law School Mergers & Acquisitions Institute. He currently serves on the Board of Directors of the Alternative Asset Center at Southern Methodist University and the Board of Trustees of the First Presbyterian Church of Dallas Foundation. Past professional and non-profit boards he has served on include the CFA Society of Dallas, Cleveland State University Foundation, the Salvation Army of Cleveland, The Cleveland Council on World Affairs, the Bay View Association and Emmanuel Promise of Hope. | 2020 | |||||||||||||||||
| Jack L. Mahaffey | 89 | Mr. Mahaffey was formerly the President and Chief Executive Officer of Shell Mining Company. Since retiring from Shell Mining Company in 1991, Mr. Mahaffey has managed his personal investments. Mr. Mahaffey served in the United States Air Force and is a former board member of the National Coal Association and the National Coal Council. | 2000 | |||||||||||||||||
| James C. Mastandrea | 77 | Mr. Mastandrea has 30+ years of experience in the real estate industry and 20+ years of experience serving in high level positions of publicly traded companies. He has served as our Chairman and Chief Executive Officer since 2006. He also served since 2003 as the President, Chief Executive Officer and Chairman of Pillarstone Capital REIT (OTC Bulletin Board). Mr. Mastandrea has also served since 1978 as the Chief Executive Officer/Founder of MDC Realty Corporation, a privately held investment company. From 1994 to 1998, Mr. Mastandrea served as Chairman and Chief Executive Officer of First Union Real Estate Investments (NYSE). Mr. Mastandrea also served in the U.S. Army. Mr. Mastandrea is a director of Cleveland State University Foundation Board and regularly lectures to MBA students at the University of Chicago and teaches as an adjunct professor at Rice University's Jones Graduate School of Business. | 2006 | |||||||||||||||||
16
| Trustee | Age(1) | Business Experience | Trustee Since | |||
| Nominee | ||||||
| Jeffrey A. Jones | 64 | Mr. Jones has over 35 years of experience as an investment banker and restructuring advisor. He currently serves, since 2018, as a Managing Director at Stephens Inc. From 2011 to 2018 he co-headed Blackhill Partners, an investment banking and restructuring firm, as its President and Partner. From 2015 through 2016 he also served as the Chief Restructuring Officer for Black Elk Energy. Mr. Jones has chaired audit committees, served on audit committees and been qualified as an expert in valuation, sale process and interest rates in federal courts in the northeast, including Delaware, the Midwest and southern U.S. He has lectured at several universities, including Northwestern University’s Kellogg School of Management and The University of Texas Law School Mergers & Acquisitions Institute. He currently serves on the Board of Directors of the Alternative Asset Center at Southern Methodist University and the Board of Trustees of the First Presbyterian Church of Dallas Foundation. Past professional and non-profit boards he has served on include the CFA Society of Dallas, Cleveland State University Foundation, the Salvation Army of Cleveland, The Cleveland Council on World Affairs, the Bay View Association and Emmanuel Promise of Hope. | 2020 | |||
| Other Trustees | ||||||
| Nandita V. Berry | 51 | Ms. Berry was formerly the 109th Texas Secretary of State from January 2014 to February 2015. She also previously served on the University of Houston System Board of Regents and held Senior Counsel positions at Locke Lord LLP and El Paso Energy Corporation. Ms. Berry began her legal career as an Associate at Haynes and Boone, LLP. Ms. Berry previously served on the Board of the Houston Zoo, Inc., the South Asian Chamber of Commerce and the Community Family Center of Houston and taught as an adjunct professor at the University of Houston. | 2017 | |||
| Paul T. Lambert | 67 | Mr. Lambert has served since 1995 as the Chief Executive Officer of Lambert Capital Corporation, a private real estate investment company. He was a co-founder of First Industrial Realty Trust, Inc. (NYSE), served on the Board of Directors and was the Chief Operating Officer from its initial public offering in October 1994 to the end of 1995. Since 1998, Mr. Lambert has also served as a trustee of Pillarstone Capital REIT (OTC Bulletin Board). | 2013 | |||
| Jack L. Mahaffey | 88 | Mr. Mahaffey was formerly the President and Chief Executive Officer of Shell Mining Company. Since retiring from Shell Mining Company in 1991, Mr. Mahaffey has managed his personal investments. Mr. Mahaffey served in the United States Air Force and is a former board member of the National Coal Association and the National Coal Council. | 2000 | |||
| James C. Mastandrea | 76 | Mr. Mastandrea has over 38 years of experience in the real estate industry and 20 years of experience serving in high level positions of publicly traded companies. He has served as our Chairman and Chief Executive Officer since 2006. He also served since 2003 as the President, Chief Executive Officer and Chairman of Pillarstone Capital REIT (OTC Bulletin Board). Mr. Mastandrea has also served since 1978 as the Chief Executive Officer/Founder of MDC Realty Corporation, a privately held investment company. From 1994 to 1998, Mr. Mastandrea served as Chairman and Chief Executive Officer of First Union Real Estate Investments (NYSE). Mr. Mastandrea also served in the U.S. Army. Mr. Mastandrea is a director of Cleveland State University Foundation Board and regularly lectures to MBA students at the University of Chicago and teaches as an adjunct professor at Rice University's Jones Graduate School of Business. | 2006 | |||||||||||||||||||||||
| Other Trustees | Other Trustees | |||||||||||||||||||||||||
| Paul T. Lambert | Paul T. Lambert | 68 | Mr. Lambert has served since 1995 as the Chief Executive Officer of Lambert Capital Corporation, a private real estate investment company. He was a co-founder of First Industrial Realty Trust, Inc. (NYSE), served on the Board of Directors and was the Chief Operating Officer from its initial public offering in October 1994 to the end of 1995. Since 1998, Mr. Lambert has also served as a trustee of Pillarstone Capital REIT (OTC Bulletin Board). | 2013 | ||||||||||||||||||||||
| David F. Taylor | 56 | Mr. Taylor currently serves as Chair of Locke Lord LLP. Mr. Taylor has been a Partner in the firm of Locke Lord LLP since 1996 and has served as a corporate and securities attorney at Locke Lord LLP since 1989. Mr. Taylor has almost three decades of experience representing public and private companies in a broad range of corporate and securities matters, with a strong focus on securities offerings and disclosures, mergers and acquisitions and corporate governance. Mr. Taylor is the former Managing Partner of Locke Lord LLP’s Houston office and the former Chair of its Finance Committee. He has also served in leadership positions within Locke Lord LLP in Strategic Growth, Practice Development and Recruiting areas. He is a member and former Co-Chair of Locke Lord LLP’s Corporate and Transactional Department and Chair of its Capital Markets Section. He also serves on the Board of The Salvation Army of Greater Houston, Theatre Under the Stars and Oldham Little Church Foundation. | 2017 | David F. Taylor | 57 | Mr. Taylor currently serves as Chair of Locke Lord LLP. Mr. Taylor has been a Partner in the firm of Locke Lord LLP since 1996 and has served as a corporate and securities attorney at Locke Lord LLP since 1989. Mr. Taylor has more than three decades of experience representing public and private companies in a broad range of corporate and securities matters, with a strong focus on securities offerings and disclosures, mergers and acquisitions and corporate governance. Mr. Taylor is the former Managing Partner of Locke Lord LLP’s Houston office and the former Chair of its Finance Committee. He has also served in leadership positions within Locke Lord LLP in Strategic Growth, Practice Development and Recruiting areas. He is a member and former Co-Chair of Locke Lord LLP’s Corporate and Transactional Department and Chair of its Capital Markets Section. He also serves on the Board of the Greater Houston Partnership, The Salvation Army of Greater Houston, Theatre Under The Stars and Oldham Little Church Foundation. | 2017 | |||||||||||||||||||
(1) As of April 1, 2020.2021.
17
Qualifications of Trustees
When considering whether our trustees and trustee nominees have the experience, qualifications, attributes and skills, taken as a whole, to enable our Board to satisfy its oversight responsibilities effectively in light of our operational and organizational structure, the Nominating and Corporate Governance Committee and the Board focused primarily on the information discussed in each of the individual biographies set forth above and on the following particular attributes:
Ms. Berry: The Board considered her significant experience as the former 109th Texas Secretary of State and her former position on the University of Houston System Board of Regents, as well as her decision-making abilities in senior positions at the Houston office of a national law firm and her background and experience in the legal industry, and determined that she is well qualified to serve as a member of our Board and as a member of the Audit Committee and the Nominating and Governance Committee. Whitestone is a significant owner of real estate in the state of Texas, and her experience and relationships are valuable to the Company.
Mr. Jones:Jones: The Board considered his significant experience as an investment banker and restructuring advisor, including his experience serving on audit committees, his qualification as an expert in valuation, sale process and interest rates in federal courts in the northeast, including Delaware, the Midwest and southern U.S. The Board also considered his educational and professional experience in the field of finance and accounting, as well as supervisory roles in the accounting industry, and determined that his experience and skills in these industries facilitate his oversight and administration of our accounting and financial reporting practices, risk management efforts and compliance with regulatory standards and determined that he is well qualified to serve in the capacity of Chairman of the Audit Committee and as a member of the Compensation Committee and our Board.
Mr. Lambert:Lambert: The Board considered his significant experience in the commercial real estate industry, including successfully launching First Industrial Realty Trust, Inc. (NYSE), and financing of real estate development projects, as well as his demonstrated leadership skills, and concluded that he is well qualified to oversee and administer our compensation programs in the capacity of Chairman of the Compensation Committee and as a member of the Nominating and Corporate Governance Committee, Audit Committee and our Board.
Mr. Mahaffey:Mahaffey: The Board considered his extensive experience and demonstrated oversight and decision-making abilities as a senior executive with large public companies, his real estate experience, and his experience in managing investments and determined that he was well qualified to perform oversight functions as the Chairman of the Nominating and Corporate Governance Committee and a member of the Compensation Committee and Audit Committee and our Board.
Mr. Mastandrea:Mastandrea: The Board considered his prior service to Whitestone as its Chairman and Chief Executive Officer, his 30+ years of experience as a leader in the commercial real estate industry, and his 20+ years of experience serving in high level positions of publicly traded companies, and determined that his leadership, intimate knowledge of Whitestone and his extensive experience and familiarity with the commercial real estate industry and public companies are critical to the oversight of our strategic initiatives and the evaluation of our growth and operational performance in his capacity as Chief Executive Officer and Chairman of our Board.
Mr. Taylor:Taylor: The Board considered his significant experience and decision-making abilities as a leader of a national law firm, as well as his background and experience in the legal industry, his corporate and securities law, corporate governance, and capital markets focus, and determined that he is well qualified to serve as a member of our Board, a member of our Compensation Committee and Nominating and Governance Committee and serve as our Lead Independent Trustee.
There are no family relationships among any of our trustees or executive officers, other than James C. Mastandrea, our Chairman and Chief Executive Officer and Christine J. Mastandrea, our Executive Vice President of Corporate Strategy, who have been married to each other for 2829 years.
18
CORPORATE GOVERNANCE
Governance Highlights
We are committed to good corporate governance, which promotes the long-term interests of shareholders, strengthens Board and management accountability and helps build public trust in the Company. This section describes our governance framework, which includes the following highlights:
•Mr. Taylor serves as lead independent trustee;trustee.
•Declassification of our Board;Board.
•Regular trustee performance assessments;assessments.
•Independent Audit, Compensation and Nominating and Corporate Governance Committees;Committees.
•Regular executive sessions of independent trustees;trustees.
•Commitment to diversity;diversity.
•Risk oversight by full Board and Committees; andCommittees.
•Share ownership guidelines for executive officers and trustees.
Independence
Under the listing standards of the NYSE, and pursuant to our Corporate Governance Guidelines and policies, , we are required to have a majority of “independent” trustees and a Nominating and Corporate Governance Committee, Compensation Committee, and Audit Committee, each composed solely of independent trustees. In determining trustee independence, the Board broadly considers all relevant facts and circumstances, including the rules of the NYSE. The Board considers these issues not merely from the standpoint of a trustee, but also from that of persons or organizations with which the trustee has an affiliation. An independent trustee is free of any relationship with Whitestone or its management that may impair the trustee’s ability to make independent judgments.
Our Board has affirmatively determined that five of our six current trustees are “independent” as that term is defined by the NYSE listing standards and applicable SEC rules. These trustees are Nandita V. Berry, Jeffrey A. Jones, Paul T. Lambert, Jack L. Mahaffey, and David F. Taylor. Mr.James C. Mastandrea is not independent because he is an employee of the Company.
19
Meetings and Committees of the Board
Our Board met fivefour times during 2019.2020. Our independent trustees meet separately in executive sessions on a regular basis, typically during a portion of, or immediately after, each regularly scheduled meeting of our Board. Mr. Taylor, as lead independent trustee, presided over the independent meetings of the trustees. All of our trustees attended at least 75% of the meetings for our Board and their assigned committees during the period of 20192020 in which they served as a trustee.
All of our trustees who were serving as trustees as ofattended our 20192020 annual meeting of shareholders attended our 2019 annual meeting of shareholders in person.shareholders. We strongly encourage our trustees to attend our annual meetings, but we do not have a formal policy regarding attendance.
Our entire Board considers all major decisions concerning our business. Our Board has also established committees so that certain matters can be addressed in more depth than may be possible at a meeting of the entire Board. Our Board has established a standing Nominating and Corporate Governance Committee, Audit Committee and Compensation Committee. Our Board’s committee membership, effective as of the date of the Annual Meeting is as follows, with the “X” denoting the members of the respective committee:
| Name | Nominating and Corporate Governance Committee | Audit Committee | Compensation Committee | Name | Nominating and Corporate Governance Committee | Audit Committee | Compensation Committee | |||||||
| Non-Employee Trustees: | Non-Employee Trustees: | |||||||||||||
| Nandita V. Berry | X | X | Nandita V. Berry | X | ||||||||||
| Jeffrey A. Jones | Chairman | X | Jeffrey A. Jones | Chairman | X | |||||||||
| Paul T. Lambert | X | Chairman | Paul T. Lambert | X | Chairman | |||||||||
| Jack L. Mahaffey | Chairman | X | Jack L. Mahaffey | Chairman | X | |||||||||
| David F. Taylor | X | X | David F. Taylor | X | X | |||||||||
| Number of Meetings in 2019 | 2 | 6 | 2 | |||||||||||
| Number of Meetings in 2020 | Number of Meetings in 2020 | 1 | 4 | — | ||||||||||
Our Board has adopted a charter for each committee. The charters are available on the Corporate Governance page of our website at www.whitestonereit.com. The information contained on our website is not, and should not be considered, a part of this Proxy Statement.
Nominating and Corporate Governance Committee
The primary purposes of the Nominating and Corporate Governance Committee are:
•identifying individuals qualified to become trustees;
•recommending nominees for committees of our Board; and
•overseeing matters concerning corporate governance practices.
The committee currently consists of Nandita V. Berry, Donald F. Keating, Jack L. Mahaffey and David F. Taylor, with Mr. Mahaffey serving as chairman. Each member of the committee is “independent” under the NYSE listing standards and applicable SEC rules.
20
The committee is responsible for identifying individuals qualified to become trustees and for evaluating potential or suggested trustee nominees. Pursuant to our bylaws, as amended, in order for an individual to qualify for nomination or election as a trustee, an individual, at the time of nomination, must have substantial expertise, experience or relationships relevant to the business of Whitestone, which may include:
•commercial real estate experience;
•an in-depth knowledge of and working experience in finance or marketing;
•capital markets or public company experience;
•university teaching experience in a Master of Business Administration or similar program;
•experience as a chief executive officer, chief operating officer or chief financial officer of a public or private company; or
•public or private company board experience.
Additionally, an individual shall not have been convicted of a felony or sanctioned or fined for a securities law violation of any nature. The committee in its sole discretion will determine whether a nominee satisfies the foregoing qualifications or possesses such other characteristics as deemed necessary by the committee. Though we have no formal policy addressing diversity, pursuant to our bylaws, as amended, the committee will seek to recommend nominees to the Board that represent a diversity of experience, gender, race, ethnicity and age. Any individual who does not satisfy the qualifications above is not eligible for nomination or election as a trustee.
The committee performs a preliminary evaluation of potential candidates primarily based on the need to fill any vacancies on our Board, the need to expand the size of our Board and the need to obtain representation in key disciplines and/or market areas. The committee will seek to identify trustee candidates based on input provided by a number of sources, including committee members and other members of our Board. The committee also has the authority to consult with or retain advisors to carry out its duties. Once a potential candidate is identified as one who fulfills a specific need, the committee performs a full evaluation of the potential candidate. This evaluation includes reviewing the potential candidate’s background information, relevant experience, willingness to serve, diversity, independence and integrity. In connection with this evaluation, the committee interviews the candidate in person or by telephone. The potential candidate is also introduced to Whitestone’s management team, properties and strategy to ensure appropriate experience and commitment exists. After completing its evaluation, the committee makes a recommendation to the full Board as to the individuals who should be nominated by our Board. Our Board elects nominees recommended by the committee to fill vacancies on our Board and nominates the nominees for election by shareholders after considering the recommendations and a report of the committee. To date, the committee has not paid a fee to any third party to assist in the process of identifying or evaluating trustee candidates.
Shareholder Nominations for Trustee
The Nominating and Corporate Governance Committee will consider for nomination all individuals recommended by shareholders in the same manner as all other trustee candidates provided that such recommendations are submitted in accordance with the procedures set forth in our bylaws. If a shareholder is recommending a candidate to serve on our Board, the candidate is expected to follow Whitestone’s candidate evaluation process, and the recommendation must include the information specified in our bylaws, including the following:
(1)As to each individual whom the shareholder proposes to nominate for election or reelection that meets the criteria of serving as a trustee as set forth in the qualifications of trustees section of our bylaws (Article III, Section 3):
aall information relating to the proposed nominee that would be required to be disclosed in connection with the solicitation of proxies for the election of the proposed nominee as a trustee in an election contest (even if an election contest is not involved), or
awould otherwise be required in connection with the solicitation, in each case pursuant to Regulation 14A (or any successor provision) under the Exchange Act and the rules thereunder (including the proposed nominee’s written consent to being named in the proxy statement as a nominee and to serving as a trustee if elected).
(2)As to any business that the shareholder proposes to bring before the meeting:
•a description of the business; and
•the shareholder’s reasons for proposing the business at the meeting and any material interest in the business of the shareholder or any shareholder associated person (as defined in our bylaws),
21
individually or in the aggregate, including any anticipated benefit from the proposal to the shareholder or the shareholder associated person.
(3)As to the shareholder giving the notice, any proposed nominee and any shareholder associated person:
•the class, series and number of all common shares or other securities of Whitestone or any of its affiliates (also referred to as Whitestone securities), if any, that are owned (beneficially or of record) by the shareholder, proposed nominee or shareholder associated person, the date on which each Whitestone security was acquired and the investment intent of the acquisition, and any short interest (including any opportunity to profit or share in any benefit from any decrease in the price of common shares or other security) in any Whitestone securities of any person;
•the record or “street name” holder for, and number of, any Whitestone securities owned beneficially but not of record by the shareholder, proposed nominee or shareholder associated person;
•whether and the extent to which the shareholder, proposed nominee or shareholder associated person, directly or indirectly (through brokers, nominees or otherwise), is subject to or during the last six months has engaged in any hedging, derivative or other transaction or series of transactions or entered into any other agreement, arrangement or understanding (including any short interest, any borrowing or lending of securities or any proxy or voting agreement), the effect or intent of which is to (i) manage for the Whitestone shareholder, proposed nominee or shareholder associated person the risk or benefit of changes in the price of (x) Whitestone securities or (y) any security of any entity that was listed in the peer group in the share performance graph in the most recent annual report to shareholders of Whitestone or (ii) increase or decrease in the voting power of the shareholder, proposed nominee or shareholder associated person in Whitestone or any affiliate thereof (or, as applicable, in any peer group company) disproportionately to the person’s economic interest in the company securities (or, as applicable, in any peer group company); and
•any substantial interest, direct or indirect (including, without limitation, any existing or prospective commercial, business or contractual relationship with Whitestone), by security holdings or otherwise, of the shareholder, proposed nominee or shareholder associated person, in Whitestone or any affiliate thereof, other than an interest arising from the ownership of Whitestone’s securities where the shareholder, proposed nominee or shareholder associated person receives no extra or special benefit not shared on a pro rata basis by all other holders of the same class or series.
(4)As to the shareholder giving the notice, any shareholder associated person with an interest or ownership referred to in paragraphs (2) and (3) above and any proposed nominee:
•the name and address of the shareholder, as they appear on our share ledger, and the current name and business address, if different, of each shareholder associated person and any proposed nominee;
•the investment strategy or objective, if any, of the shareholder and each shareholder associated person who is not an individual and a copy of the prospectus, offering memorandum or similar document, if any, provided to investors or potential investors in the shareholder, each shareholder associated person and any proposed nominee; and
•to the extent known by the shareholder giving the notice, the name and address of any other shareholder supporting the nominee for election or reelection as a trustee or the proposal of other business on the date of the shareholder’s notice.
The foregoing description of our advance notice provisions is a summary and is qualified in its entirety by reference to the full text of our bylaws, which were filed with the SEC as Exhibit 3.1 to our Current Report on Form 8-K filed on October 9, 2008. Accordingly, we advise you to review our bylaws for additional stipulations relating to advance notice of trustee nominations and shareholder proposals. For a description of the applicable deadlines for shareholder proposals, see “Solicitation and Voting - How and when may I submit a shareholder proposal for Whitestone’s 20212022 annual meeting of shareholders?”
22
Audit Committee
The primary purposes of the Audit Committee are:
•overseeing our accounting and financial reporting process, the audits of our financial statements; and assisting the Board in its oversight of the following:
i.management’s responsibilities to assure there is in place an effective system of internal controls over financial reporting;
ii.the qualifications and independence of our registered public accounting firm;
iii.the performance of our registered public accounting firm; and
iv.our compliance with our ethical standards, policies, plans and procedures, and applicable laws and regulations.
The committee also prepares a report each year for inclusion in our proxy statement in accordance with the rules of the SEC.
The committee currently consists of Nandita V. Berry, Donald F. Keating, Jeffrey A. Jones and Paul T. Lambert, with Mr. KeatingJones serving as chairman. On April 1, 2020, Mr. Keating notified the Company that he will not stand for re-election at our Annual Meeting. Effective, as of the date of the Annual Meeting, Mr. Jones will serve as chairman. Our Board has determined that both Mr. Keating and Mr. Jones areis an “audit committee financial experts”expert” as defined by the rules promulgated by the SEC. Each member of the committee is “independent” under the NYSE listing standards and applicable SEC rules.
Compensation Committee
The primary purposes of the Compensation Committee are:
•assisting our Board in discharging its responsibilities relating to our overall compensation and benefit structure;
•producing an annual report on executive compensation for inclusion in our proxy statement in accordance with applicable rules and regulations;
•reviewing and approving Chief Executive Officer compensation as well as executive officer compensation;
•annually reviewing and making recommendations to the Board concerning the adoption, terms and operation of the Company’s compensation plans for all trustees, officers and other executives, including incentive compensation and equity-based plans that are subject to Board approval; and
•approving grants and/or awards of restricted shares, share options and other forms of equity-based compensation, and otherwise administer the Company’s equity incentive plans in compliance with applicable tax laws.
The committee currently consists of Jeffrey A. Jones, Paul T. Lambert, Jack L. Mahaffey and David F. Taylor, with Mr. Lambert serving as chairman. Each member of the committee is “independent” under the NYSE listing standards and applicable SEC rules.
The committee has the sole authority to oversee the administration of compensation programs applicable to our executive officers and trustees and to recommend for approval by the Board the compensation of our Chief Executive Officer. The committee also administers our 2008 Long-Term Equity Incentive Ownership Plan (the “2008 Plan”) and our 2018 Long-Term Equity Incentive Ownership Plan (the “2018 Plan”).
Executive compensation is reviewed at least annually by the committee. Our Chief Executive Officer completes performance reviews annually and provides recommendations to the committee with respect to our other executive officers. Trustee compensation is reviewed periodically by the committee as its members deem appropriate. The committee may delegate some or all of its authority to subcommittees when it deems appropriate. See “Compensation Discussion and Analysis” for more information regarding the committee’s processes and procedures for consideration and determination of executive compensation.
The committee has the authority to engage and approve fees and other retention terms of outside advisors, without the approval of the Board or management, to assist it in the performance of its duties. Information on the committee's processes and procedures for consideration of executive compensation is provided in the Compensation Discussion and Analysis below.
For reference to all committee charters, please visit our website at www.whitestonereit.com.
23
Code of Business Conduct and Ethics
Our Board has adopted a Code of Business Conduct and Ethics that is applicable to all members of our Board, our executive officers and our employees. We have posted our Code of Business Conduct and Ethics on the Corporate Governance section of our website at www.whitestonereit.com. If we amend or grant any waiver from a provision of our Code of Business Conduct and Ethics, we will promptly disclose such amendment or waiver in accordance with and if required by applicable law, including by posting such amendment or waiver on our website at the address above.
Board Leadership Structure
Our Board believes that our Chief Executive Officer is well qualified and best situated to serve as Chairman because he is the trustee most familiar with the Company’s strategic business plan, real estate, public and capital markets and industry, and most capable of effectively identifying strategic priorities and leading the discussion and execution of strategic initiatives. Independent trustees and management have different perspectives and roles in strategy development. Our independent trustees bring experience, oversight and expertise from outside our Company and industry, while the Chief Executive Officer brings company-specific experience and leadership.
Our independent trustees meet separately in executive sessions on a regular basis, typically during a portion of, or immediately after, each regularly scheduled meeting of our Board. Mr. Taylor serves as our lead independent trustee to preside over executive sessions of the independent trustees. The duties of the lead independent trustee are detailed in the Company’s Corporate Governance Guidelines, which are available on the Corporate Governance page of the Company’s website, www.whitestonereit.com,, and include:
•presiding at meetings of the Board at which the Chairman is not present, including executive sessions of the independent trustees;
•serving as liaison between the Chairman and the independent trustees;
•previewing the information to be provided to the Board;
•approving meeting agendas for the Board;
•assuring that there is sufficient time for discussion of all meeting agenda items;
•organizing and leading the Board’s evaluation of the CEO;
•being responsible for leading the Board’s annual self-assessment.
One of the key responsibilities of the Board is to develop strategic direction and hold management accountable for the execution of strategy once it is developed. The Board believes the combined role of Chairman and Chief Executive Officer, in addition to a lead independent trustee, is in the best interest of shareholders because it provides the appropriate balance between strategy development and independent oversight of management.
Risk Management
Our Board has an active role, as a whole and also at the committee level, in overseeing management of our risks. Our Board regularly reviews information regarding our credit, liquidity and operations, as well as the risks associated with each. The Compensation Committee is responsible for overseeing the management of risks relating to our executive compensation plans and arrangements, as more fully described in “Compensation Discussion and Analysis-Compensation Related Risk Management.” The Audit Committee oversees management of financial and legal compliance risks. The Nominating and Corporate Governance Committee manages risks associated with the independence of the Board and potential conflicts of interest. While each committee is responsible for evaluating certain risks and overseeing the management of such risks, the entire Board is regularly informed through committee reports about such risks. Specific actions that have been taken by the Board include:
•Expenditures for capital projects of over $3.0 million require Board approval, and expenditures for all other items over $1.0 million require Board approval;
•A Board-level Investment Committee that reviews and approves all acquisition and disposition decisions;
•A limitation on base salary of $100,000 for any employee hired unless the Compensation Committee approves a greater amount; and
•A compliance policy regarding insider information, disclosure of non-public information and limitation on employee and trustee transactions of our shares.
24
The Audit Committee considers risks relating to cybersecurity and, for that purpose, receives regular reports from management regarding cybersecurity risks and countermeasures being undertaken or considered by the Company, including updates on the internal and external cybersecurity landscape and relevant technical developments.
Corporate Responsibility and Sustainability
The Company is focused on building a thriving and sustainable, e-commerce resistant business that succeeds by delivering long-term value for our shareholders. We are proud of the growth we have achieved and how we have conducted our business in the process. WeOur plan for sustainability is incorporated into our long-term strategy as we continue to seek new ways to positively contribute to our communities and safeguard the environment around them. Our key corporate responsibility priorities include openly engaging key stakeholders, leading by example in our operations, positively influencing our tenants and partners and enhancing our communities. Our efforts this year include the initiation of anWe continue to build our Environmental, Social, and Governance (“ESG”) Platformplatform and our Corporate Responsibility & Sustainability Report, which is set forth in Whitestone’s Sustainability Statement. Included with this statement in this initiation are Whitestone’s Human Rights Policy,posted on our Vendor Code of Conduct Policy, our OSHA Occupational Safety Policy and Procedures Manual and the Charter for Whitestone’s ESG Steering Committee. All these documents can be found under the Investor Relations Section of Whitestone’s website at www.whitestonereit.com, contains greater details as to our ongoing efforts.
ESG Steering Committee
commitment to environmental, health and safety, corporate social responsibility, corporate governance, sustainability, and
other public policy matters relevant to the Company.
The ESG Committee is a cross-functional senior management committee of the Company.Company under the oversight of the Board
of Trustees. Its mission is to assist the executive management of the Company in:
•Setting general strategy relating to ESG Mattersmatters
•Developing, implementing, and monitoring initiatives and policies based on that strategy
•Overseeing communications with employees, investors and stakeholders with respect to ESG Matters,matters, and
•Monitoring and assessing developments relating to, and improving the Company’s understanding of ESG Matters.matters.
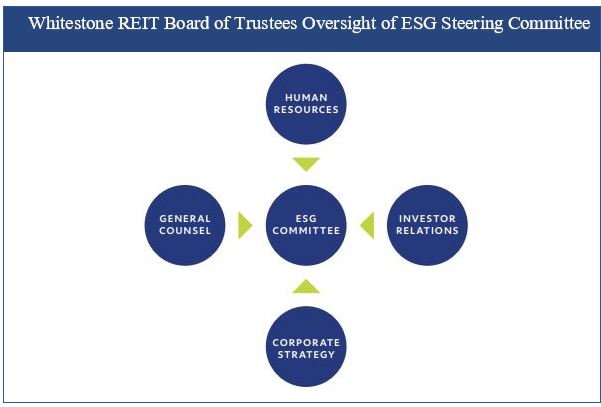
25
Since establishing our ESG Steering Committee in 2018, our ongoing efforts to do our part in contributing to a net zero carbon economy is to continue evaluating how our properties and operations affect the communities we serve. We believe that environmentally and socially responsible operating practices are in sync with generating value for our stakeholders and risk mitigating protection for that value we create. With this goal in mind, we are in the process of performing a robust diagnostic analysis of our current practices and procedures and looking for the best platform to allow us to efficiently report to leading ESG frameworks and ratings agencies, including but not limited to, GRESB, TCFD, and SASB. We feel that reporting in alignment with the recommendations of these ESG frameworks is in the best long-term interests of our stakeholders.
Communications with our Board
We have established procedures for shareholders or other interested parties to communicate with our Board, including our independent trustees. Such parties can contact the Board by sending a letter to: Whitestone REIT, Attn: Corporate Secretary, 2600 South Gessner Road, Suite 500, Houston, Texas 77063. Our Corporate Secretary will review all communications made by this means and forward the communication to our Board or to any individual trustee to whom the communication is addressed.
Share Ownership Guidelines
Minimum Share Ownership Guidelines for Executives. Our Board established minimum share ownership guidelines for executive officers requiring such officers to maintain a minimum equity investment in Whitestone based upon a multiple of five times base salary for the Chief Executive Officer and three times base salary for all other Named Executive Officers.Officers ("NEO"). The guidelines provide that executive officers must achieve the minimum equity investment within five years from the date he or she first becomes subject to the guidelines, and until such time, that executive must retain at least 60% of the common shares granted to the executive by us and/or purchased by the executive through the exercise of options. Each executive officer’s compliance with the guidelines is reviewed by the Board annually. All of our executive officers are currently in compliance with the minimum share ownership guidelines, subject to the time period as discussed above for achieving the minimum equity investment.
Minimum Share Ownership Guidelines for Non-employee Trustees. Our Board established minimum share ownership guidelines for non-employee trustees. Under these guidelines, each non-employee trustee must maintain a minimum number of our common shares with a value not less than five times the current annual cash retainer paid to such trustee for service on our Board (excluding, among other things, any additional retainer paid for committee membership or chairmanship). Each non-employee trustee has five years from the date he or she first becomes subject to the guidelines to satisfy the minimum ownership guidelines, and until such time, that trustee must retain 100% of the common shares or share units granted to the trustee as compensation. Compliance with the guidelines is reviewed by the Board annually. All of our non-employee trustees are currently in compliance with the minimum share ownership guidelines, subject to the time period as discussed above for achieving the minimum equity investment.
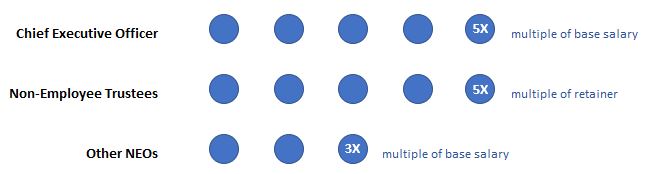
26
SECURITY OWNERSHIP OF CERTAIN BENEFICIAL OWNERS AND MANAGEMENT
Trustees and Executive Officers
The following table sets forth information as of February 18, 202016, 2021 regarding the beneficial ownership of our common shares by each of our trustees and our named executive officers and by all trustees and executive officers as a group. The percentage ownership in the following table is based on 42,046,73242,478,720 common shares outstanding as of the close of business on February 18, 2020.16, 2021.
Name of Beneficial Owner(1) | Common Shares and Units Beneficially Owned(2) | Percentage Ownership | ||||||
| Named Executive Officers: | ||||||||
| James C. Mastandrea | 1,865,377(3) | 4.4% (4) | ||||||
| David K. Holeman | 530,506(5) | 1.2% | ||||||
| John J. Dee | 228,071(6) | * | ||||||
| Bradford Johnson | 263,309(7) | * | ||||||
| Christine J. Mastandrea | 1,865,377(8) | 4.4% (4) | ||||||
| Non-Employee Trustees: | ||||||||
| Nandita V. Berry | 19,637 | * | ||||||
| Jeffrey A. Jones | 10,787 | * | ||||||
| Paul T. Lambert | 70,422 | * | ||||||
| Jack L. Mahaffey | 58,219 | * | ||||||
| David F. Taylor | 15,424 | * | ||||||
All executive officers and trustees as a Group (10 persons) (9) (10) | 3,061,752 | 7.2% | ||||||
Name of Beneficial Owner(1) | Common Shares and Units Beneficially Owned(2) | Percentage Ownership | |
| Named Executive Officers: | |||
| James C. Mastandrea | 1,610,082(3) | 3.8% (4) | |
| David K. Holeman | 458,363(5) | 1.1% | |
| John J. Dee | 190,734(6) | * | |
| Bradford Johnson | 225,703(7) | * | |
| Christine J. Mastandrea | 1,610,082(8) | 3.8% (4) | |
| Non-Employee Trustees: | |||
| Nandita V. Berry | 11,163 | * | |
| Jeffrey A. Jones | — | * | |
| Donald F. Keeting | 43,269 | * | |
| Paul T. Lambert | 65,373 | * | |
| Jack L. Mahaffey | 53,170 | * | |
| David F. Taylor | 8,375 | * | |
All executive officers and trustees as a Group (10 persons) (9) (10) | 2,666,230 | 6.3% | |
* Less than 1%
(1)Unless otherwise indicated, the address for each beneficial owner is 2600 South Gessner, Suite 500, Houston, Texas 77063.
(2)Beneficial ownership is determined in accordance with the rules of the SEC that deem shares to be beneficially owned by any person or group who has or shares voting or investment power with respect to those shares. Unless otherwise indicated, and subject to community property laws where applicable, we believe each beneficial owner has sole voting and investment power over the shares beneficially owned.
(3)Includes 250,853 restricted common share units and 126,431 common shares held by Midwest Development Venture IV, of which Mr. Mastandrea is the general partner and a limited partner, with respect to which Mr. Mastandrea has sole investment power. Excludes 271,655 restricted common share units issued pursuant to the 2008 and 2018 Plans that contain no voting or dividend rights and are subject to vesting dependent on our achieving certain performance targets, and 200,000 restricted common share units issued pursuant to the 2008 Plan that contain no voting or dividend rights and are subject to vesting only in the event of a Change in Control (as defined in the 2008 Plan). Also includes 207,412 common shares and 60,696 restricted common share units held by Christine J. Mastandrea, Mr. Mastandrea’s spouse. Mr. Mastandrea disclaims beneficial ownership of shares held by his spouse, except to the extent of his pecuniary interest therein.
(4)The total number of common shares outstanding used in calculating Mr. Mastandrea’s and Ms. Mastandrea’s percentage ownership assumes that all OP units held by Mr. Mastandrea are redeemed for common shares and none of the OP units held by other persons are redeemed for common shares.
27
(5)Includes 122,906 restricted common share units. Excludes 132,786 restricted common share units issued pursuant to the 2008 and 2018 Plan that contain no voting or dividend rights and are subject to vesting dependent on our achieving certain performance targets, and 150,000 restricted common share units issued pursuant to the 2008 Plan that contain no voting or dividend rights and are subject to vesting only in the event of a Change in Control.
(6)Includes 60,028 restricted common share units. Excludes 65,481 restricted common share units issued pursuant to the 2008 and 2018 Plan that contain no voting or dividend rights and are subject to vesting dependent on our achieving certain performance targets, and 75,000 restricted common share units issued pursuant to the 2008 Plan that contain no voting or dividend rights and are subject to vesting only in the event of a Change in Control.
(7)Includes 60,696 restricted common share units. Excludes 65,481 restricted common share units issued pursuant to the 2008 and 2018 Plan that contain no voting or dividend rights and are subject to vesting dependent on our achieving certain performance targets, and 100,000 restricted common share units issued pursuant to the 2008 Plan that contain no voting or dividend rights and are subject to vesting only in the event of a Change in Control.
(8)Includes 60,696 restricted common share units. Excludes 65,481 restricted common share units issued pursuant to the 2008 and 2018 Plan that contain no voting or dividend rights and are subject to vesting dependent on our achieving certain performance targets, and 100,000 restricted common share units issued pursuant to the 2008 Plan that contain no voting or dividend rights and are subject to vesting only in the event of a Change in Control. Also includes 10,336 common shares pledged to secure a margin loan and 1,155,659 common shares, 250,853 restricted common share units, 64,326 OP Units, which are currently redeemable for cash or, at our option, for common shares on a one-for-one basis, held by James C. Mastandrea, Ms. Mastandrea’s spouse, and 126,431 common shares held by Midwest Development Venture IV, of which James C. Mastandrea is the general partner and a limited partner, with respect to which Mr. Mastandrea has sole investment power. Ms. Mastandrea disclaims beneficial ownership of shares held by her spouse, except to the extent of her pecuniary interest therein.
(9)Except as otherwise described herein, none of the shares beneficially owned by our trustees or named executive officers have been pledged as security for an obligation.
(10)In computing the aggregate number of shares and units beneficially owned and the aggregate percentage ownership by all executive officers and trustees as a group, shares and units beneficially owned by both Mr. Mastandrea and Ms. Mastandrea have not been counted twice.
28
Beneficial Owners of More Than 5% of Common Shares
The following table sets forth information regarding the beneficial ownership of our common shares by each person, or group of affiliated persons, who is believed by us to beneficially own 5% or more of our common shares. The percentage of class owned in the following table is based upon 42,046,73242,478,720 common shares outstanding as of the close of business on February 18, 2020.
16, 2021.
| Name and Address of Beneficial Owner | Common Shares Beneficially Owned | Percent of Class | ||||||
BlackRock Inc. 55 East 52nd Street New York, NY 10055 | ||||||||
The Vanguard Group, Inc. 100 Vanguard Boulevard Malvern, PA 19355 | ||||||||
(1)The indicated ownership is based solely upon an amendment to Schedule 13G/A filed with the SEC by the beneficial owner on January 26, 2021 reporting beneficial ownership as of December 31, 2020. BlackRock, Inc. possessed sole voting power over 6,282,858 common shares and sole dispositive power over 6,329,084 common shares.
(2)The indicated ownership is based solely upon an amendment to Schedule 13G/A filed with the SEC by the beneficial owner on March 10, 2021 reporting beneficial ownership as of December 31, 2020. The Vanguard Group, Inc. possessed shared voting power over 27,287 common shares, sole dispositive power over 4,270,145 common shares and shared dispositive power over 37,823 common shares.
Delinquent Section 16(a) Reports
Section 16(a) of the Exchange Act, and the disclosure requirements of Item 405 of SEC Regulation S-K, require our trustees and executive officers and persons who own more than 10% of our common shares to file reports of ownership and changes in ownership with the SEC. These persons are required by SEC rules to furnish us with copies of these reports. During the fiscal year ended December 31, 2020, Mr. Mastandrea and Ms. Mastandrea failed to timely file one Form 4 reporting one transaction. The transaction was reported on a Form 4 filed on March 18, 2021. In addition, Mr. Jones failed to timely file a Form 3 upon becoming a trustee of the Company. The Form 3 was filed on February 19, 2020. Based solely on a review of the written statements and copies of such reports furnished to us by our executive officers, trustees and greater than 10% beneficial owners, we believe that during fiscal year ended December 31, 2019,2020, all other Section 16(a) filing requirements applicable to any officers, trustees and shareholders were timely satisfied.
29
EXECUTIVE OFFICERS
The following table sets forth certain information about our executive officers. Our executive officers serve one-year terms at the pleasure of our Board.
Executive Officers | Age(1) | Position | Recent Business Experience | |||||||||
| James C. Mastandrea | Chairman of the Board of Trustees and Chief Executive Officer (October 2006 - present) | Chief Executive Officer and Chairman of Pillarstone Capital REIT, an OTC Bulletin Board real estate company (2003 - present); Chief Executive Officer/Founder of MDC Realty Corporation, a privately held investment company (1978 - present); Chairman and Chief Executive Officer of First Union Real Estate Investments, a NYSE listed REIT (1994 - 1998). | ||||||||||
| David K. Holeman | Chief Financial Officer (November 2006 - present) | Chief Financial Officer of Hartman Management, our former advisor (2006); Vice President and Chief Financial Officer of Gexa Energy, a NASDAQ listed retail electricity provider (2004 - 2006); Controller and Chief Financial Officer of Houston Cellular Telephone Company (1994 - 2003). | ||||||||||
| John J. Dee | Chief Operating Officer (October 2006 - present) | Trustee, Senior Vice President, and Chief Financial Officer of Pillarstone Capital REIT (2003 - present); Senior Vice President and Chief Financial Officer of MDC Realty Corporation, a privately held residential and commercial real estate development company (2002 - 2003); Director of Finance and Administration for Frantz Ward, LLP (2000 - 2002); several management positions including Senior Vice President and Chief Accounting Officer with First Union Real Estate Investments, a NYSE listed REIT (1978 - 2000). | ||||||||||
| Bradford D. Johnson | Executive Vice President of Acquisitions and Asset Management (2010 - present) | Vice President Acquisitions and Development of Campus Living Villages Funds (REIT), subsidiary of Transfield Holdings Group, fund sponsor, developer and owner (2008 - 2010); Director of Place Properties Inc., military and student-housing developer, owner and operator (2003 - 2007); Chief Financial Officer and Director - Matrix Health Care Development Inc., developer, owner and senior housing operator (1995 - 2003). | ||||||||||
| Christine J. Mastandrea | Executive Vice President of Corporate Strategy (2013 - present) | Independent advisor to the Company (2006 - 2012). Chief Operating Officer of MDC Realty Corporation, a privately investment company (1996 - present). | ||||||||||
| Peter A. Tropoli | 49 | General Counsel ( 2019 - present) | Chief Operating Officer (2011-2018), Director (2014-2019), Corporate Secretary (2006-2011) and Senior Vice President-Administration, General Counsel (2001-2011, 2019) of Luby's Inc., a NYSE listed retail restaurant operating company. | |||||||||
______________
(1) As of April 1, 20202021
30
TRUSTEE COMPENSATION
We use a combination of cash and share-based compensation to attract and retain qualified candidates to serve on the Board. In setting Board compensation, the Board considers the significant amount of time trustees expend in fulfilling their duties as well as the skill level it requires of members of the Board.
In 2019, our non-employee trustees were paid an annual trustee fee of $20,000. In addition, our non-employee trustees received $1,000 for each in-person or $500 for each telephonic Board meeting they attended. Trustees did not receive additional compensation for committee meetings. Non-employee trustees were also reimbursed for out-of-pocket expenses incurred to attend Board meetings and paid a $1,000 per diem fee when an independent trustee was required to travel to another city to review properties for acquisition or perform other services. Additionally, each non-employee trustee received an annual grant of 3,000 common shares and, if a non-employee trustee so chose, could receive any monetary fees in the form of common shares.
•Annual retainer fee of $30,000$20,000
•Lead independent trustee fee of $6,250$5,000
•Annual share grant - $50,000$41,250 grant date value
•Annual committee fees of:
◦Chair-Audit Committee - $4,000
◦Chair-Compensation Committee - $3,000
◦Chair-Nominating and Governance Committee - $2,000
◦Member-Audit Committee - $2,000
◦Member-Compensation Committee - $1,000
◦Member-Nominating and Governance Committee - $1,000
Effective January 1, 2021, our non-employee trustees will be paid the following fees:
•Annual retainer fee of $40,000$30,000
•Lead independent trustee fee of $6,250
•Annual share grant - $50,000 grant date value
•Annual committee fees of:
◦Chair-Audit Committee - $7,500
◦Chair-Compensation Committee - $6,500
◦Chair-Nominating and Governance Committee - $5,000
◦Member-Audit Committee - $6,000
◦Member-Compensation Committee - $5,000
◦Member-Nominating and Governance Committee - $3,000
Effective January 1, 2022, our non-employee trustees will be paid the following fees:
•Annual retainer fee of $40,000
•Lead independent trustee fee of $12,500
•Annual share grant - $60,000 grant date value
•Annual committee fees of:
◦Chair-Audit Committee - $15,000
◦Chair-Compensation Committee - $13,000
◦Chair-Nominating and Governance Committee - $10,000
◦Member-Audit Committee - $12,000
◦Member-Compensation Committee - $10,000
◦Member-Nominating and Governance Committee - $6,000
The trustees may elect to receive the cash portion of their fees in our common shares, rather than in cash. The table below summarizes the compensation the Company paid to each non-employee trustee in 2019:2020:
31
Name(1) | Fees Earned or Paid in Cash ($) | Share Awards(2) ($) | Total ($) | Name(1) | Fees Earned or Paid in Cash ($) | Share Awards(2) ($) | Total ($) | ||||||||||
| Nandita V. Berry | — | 64,250 | 64,250 | Nandita V. Berry | — | 69,250 | 69,250 | ||||||||||
| Jeffrey A. Jones | Jeffrey A. Jones | 27,466 | 37,068 | 64,534 | |||||||||||||
| Donald F. Keating | 23,000 | 41,250 | 64,250 | Donald F. Keating | 9,178 | 15,144 | 24,322 | ||||||||||
| Najeeb A. Khan | 11,911 | 21,473 | 33,384 | ||||||||||||||
| Paul T. Lambert | — | 64,250 | 64,250 | Paul T. Lambert | 25,000 | 41,250 | 66,250 | ||||||||||
| Jack L. Mahaffey | 22,500 | 41,250 | 63,750 | Jack L. Mahaffey | 23,000 | 41,250 | 64,250 | ||||||||||
| David F. Taylor | 24,000 | 41,250 | 65,250 | David F. Taylor | 27,000 | 41,250 | 68,250 | ||||||||||
(1)James C. Mastandrea, our Chairman of the Board and Chief Executive Officer, is not included in the table as he is an employee and thus receives no compensation for his services as a trustee. The compensation received by Mr. Mastandrea is included under “Executive Compensation - Summary Compensation Table” below.
(2)On December 4, 2020, Ms. Berry and Messrs. Lambert, Mahaffey and Taylor were awarded 5,049 common shares each, and Mr. Jones and Mr. Keating were awarded 4,537 and 1,854 common shares, respectively. Ms. Berry elected to receive the cash portion of her trustee fees ($28,000) in common shares. The share award amounts represent the grant date fair value of share awards measured in accordance with ASC Topic 718, utilizing the assumptions discussed in Note 15 to our audited financial statements for the year ended December 31, 2020 as included in our Annual Report.
32
COMPENSATION DISCUSSION AND ANALYSIS
Throughout this discussion, James C. Mastandrea, Chairman and Chief Executive Officer, David K. Holeman, Chief Financial Officer, John J. Dee, Chief Operating Officer, Bradford D. Johnson, Executive Vice President of Acquisitions and Asset Management, and Christine J. Mastandrea, Executive Vice President of Corporate Strategy, are the executives referred to as NEOs.
Executive Summary
The Board and management team are committed to continuing the successful implementation and growth of our e-commerce resistant retail Community Centered Property® model. Since 2010, our business model and performance-based compensation structure have resulted in industry-leading growth rates in operational and financial metrics, evidenced by Whitestone’s #1 and #2 ranking among all U.S. public shopping center REITs for Total Shareholder Return (“TSR”) for the past 3 and 5 years, respectively.years. See “Pay Related to Market Performance Summary.”
Say-On-Pay Results and Shareholder Engagement
33
PAY FOR OPERATING PERFORMANCE SUMMARY
Whitestone Performance - 20192020
The information presented below demonstrates that our NEOs accomplished significant goals on behalf of our shareholders in 2019.2020. We believe these results are due to the alignment between our NEOs'NEOs’ interests and those of our shareholders through our executive compensation plans, including our 2008 Plan and our 2018 Plans,Plan, under which we predominantly issue performance-based equity grants. We believe the information in this Compensation Discussion and Analysis (“CD&A”&A”) also demonstrates that our compensation program is commensurate with our Company’s growth and follows best practices in our industry.
In 2019,March 2020, as the U.S. and global economy started to turn down, we achieved substantial growthshifted from our operating plan to a crisis management plan. While 75% of our employees worked from home, our senior management team was in many keythe office daily. We quickly implemented the following actions:
•Engaged with all tenants to help them operate their businesses safely and access available financial resources
•Stopped all cash out-flows for development and operating areasre-development projects
•Halted pending acquisitions
•Froze salary increases for the second year
•Applied a reduction in workforce
•Temporarily drew down the available funds from our line of credit
•Reduced our dividend
•Reviewed our cash position daily
•Held daily virtual meetings, which were hosted by leaders at every level with their respective teams, and weekly CEO-hosted virtual town halls to provide employees with company-wide updates.
•Provided ongoing communication with stakeholders to keep them fully informed of our ongoing progress as we navigated the economic response to the pandemic
As the year progressed, and through the outstanding efforts of our committed team, we have been able to perform even under the toughest of circumstances. Highlights of our 2020 performance include:
•Strong Rental Collections. Over the past year, Whitestone has consistently been near, or at-the-top of the business.shopping center industry regarding quarterly cash rental collections.
| Period | Whitestone | Shopping Center Peer Average (1) | ||||||
| Q2 2020 | 81% | 73% | ||||||
| Q3 2020 | 90% | 88% | ||||||
| Q4 2020 | 95% | 93% | ||||||
| January, 2021 | 96% | |||||||
(1) Source: Public filings for Acadia Realty Trust, Brixmor Property Group Inc., Cedar Realty Trust Inc., Federal Realty Investment Trust, Kimco Realty Corp., Kite Realty Group Trust, RPT Realty, Regency Centers Corp., Retail Opportunity Investments Corp., Retail Properties of America, Inc., Retail Value, Inc., Saul Centers Inc., Site Centers Corp, Urban Edge Properties, Urstadt Biddle Properties Inc.and Weingarten Realty Investors..
•Solid Tenant Leasing. Our square foot leasing activity was 10% higher in the fourth quarter of 2020 than the fourth quarter of 2019 include the following:
•Foot Traffic Recovery.We believe that one of the most encouraging signs and a good harbinger of things to come is the significant foot traffic we are seeing at our properties. A December 2020 article by S&P Global highlighted Whitestone’s #1 Ranking for the Shopping Center Industry in foot traffic recovery on Black Friday, with an 81% year-
34
over-year recovery, which far outpaced the industry average of only 48%. This also supports and confirms our internal research using third party AI software that showed an over 80% year-over-year recovery at our properties for the month of November 2020.
•Uninterrupted Monthly Dividends. As one of the few monthly dividend paying public REITs, we were conscientious of the importance of the monthly dividend to our shareholders. Albeit at a reduced rate, we continued paying monthly dividends while many others suspended distributions. With the strength, stability, and predictability of our cash flows, we continued the uninterrupted dividend payouts for 127 consecutive months to date since our IPO.
•Lowering Debt Leverage. We reduced our total net debt, defined as outstanding debt plus pro rata share of outstanding debt of real estate partnership less cash and pro rata share of cash of real estate partnership, by $12.0 million, or 2% compared to the prior year.
2020 Full Year Operating and Financial Highlights
All per share amounts are on a diluted per common share and operating model, which we believe will continuepartnership (“OP”) unit basis unless stated otherwise. A $1.7 million gain from PPP Loan forgiveness was included in fourth quarter and full year net income attributable to allow uscommon shareholders and funds from operations.
•Net Income attributable to growcommon shareholders of $0.14 per diluted share
•Funds from Operations (“FFO”), as defined by the National Association of Real Estate Investment Trusts (“NAREIT”), was $0.83 per share
•FFO Core was $0.93 per share
•Comparable GAAP-based leasing spreads of 8.9%
•Same-store Net Operating Income (“NOI”) decreased 4.4%
•Bad debt/uncollectible revenue was $6.9 million, or $0.16 per share, primarily due to COVID-19 pandemic and result in further increases in profitabilityincluded $1.2 million of non-cash straight-line rent
COVID-19 Update Summary (as of February 23, 2021)
•All 53 community centers are open and shareholder value.
have remained open throughout the pandemic
•99% of tenants are open and operating (based on ABR)
•95% of fourth quarter 2020 contractual rents have been collected
•96% of total January contractual rents have been collected to date
•Entered into rent deferral agreements representing 3% of fourth quarter 2020 revenue
•Grew cash and cash equivalents by $10.2 million from prior year
NOI, FFO and FFO Core are financial measures that are not calculated pursuant to U.S. generally accepted accounting principles (“GAAP”GAAP”). Please refer to APPENDEXAPPENDIX A - NON-GAAP MEASURES for explanations and reconciliations of these metrics to their most comparable GAAP metric.
.
35
PAY RELATED TO MARKET PERFOMANCEPERFORMANCE SUMMARY
The following graphs illustrategraph illustrates the TSR of Whitestone versus the companies included in the SNL U.S. Shopping Center Index for the three-year and five-year periodsperiod ended December 31, 2019.
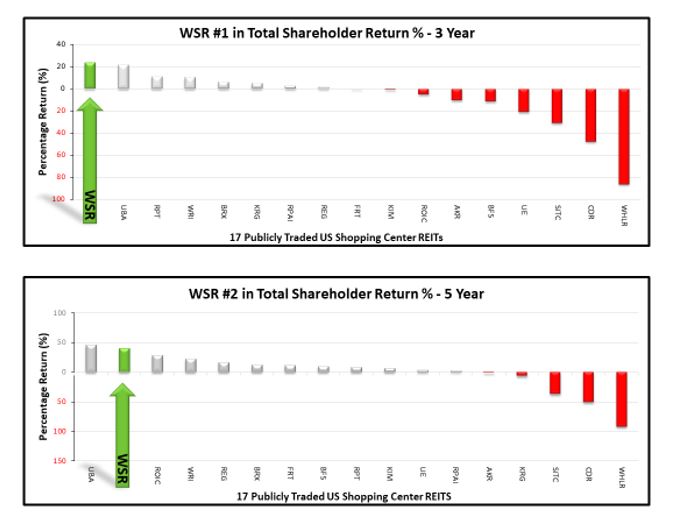
2020.
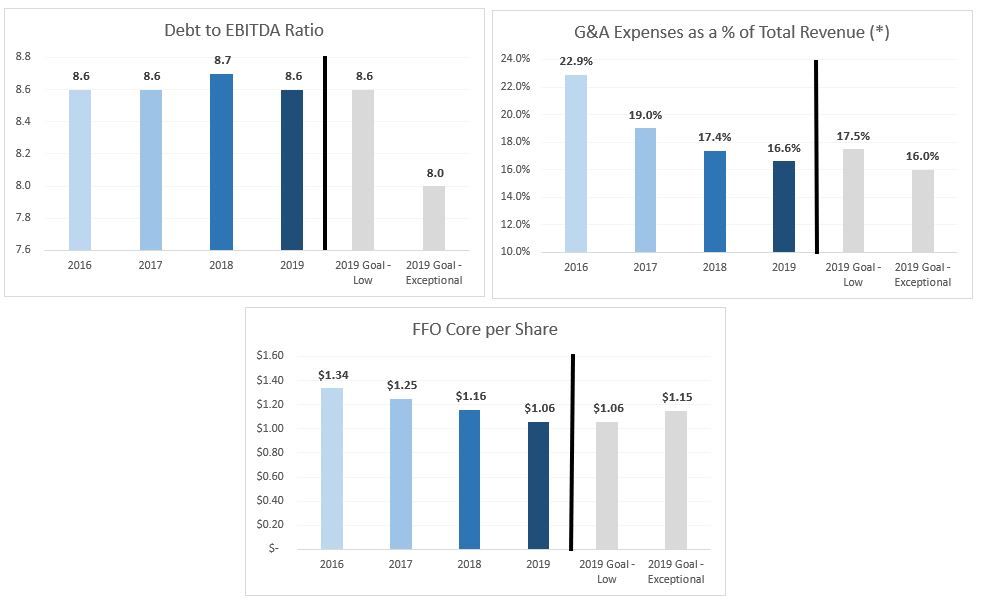
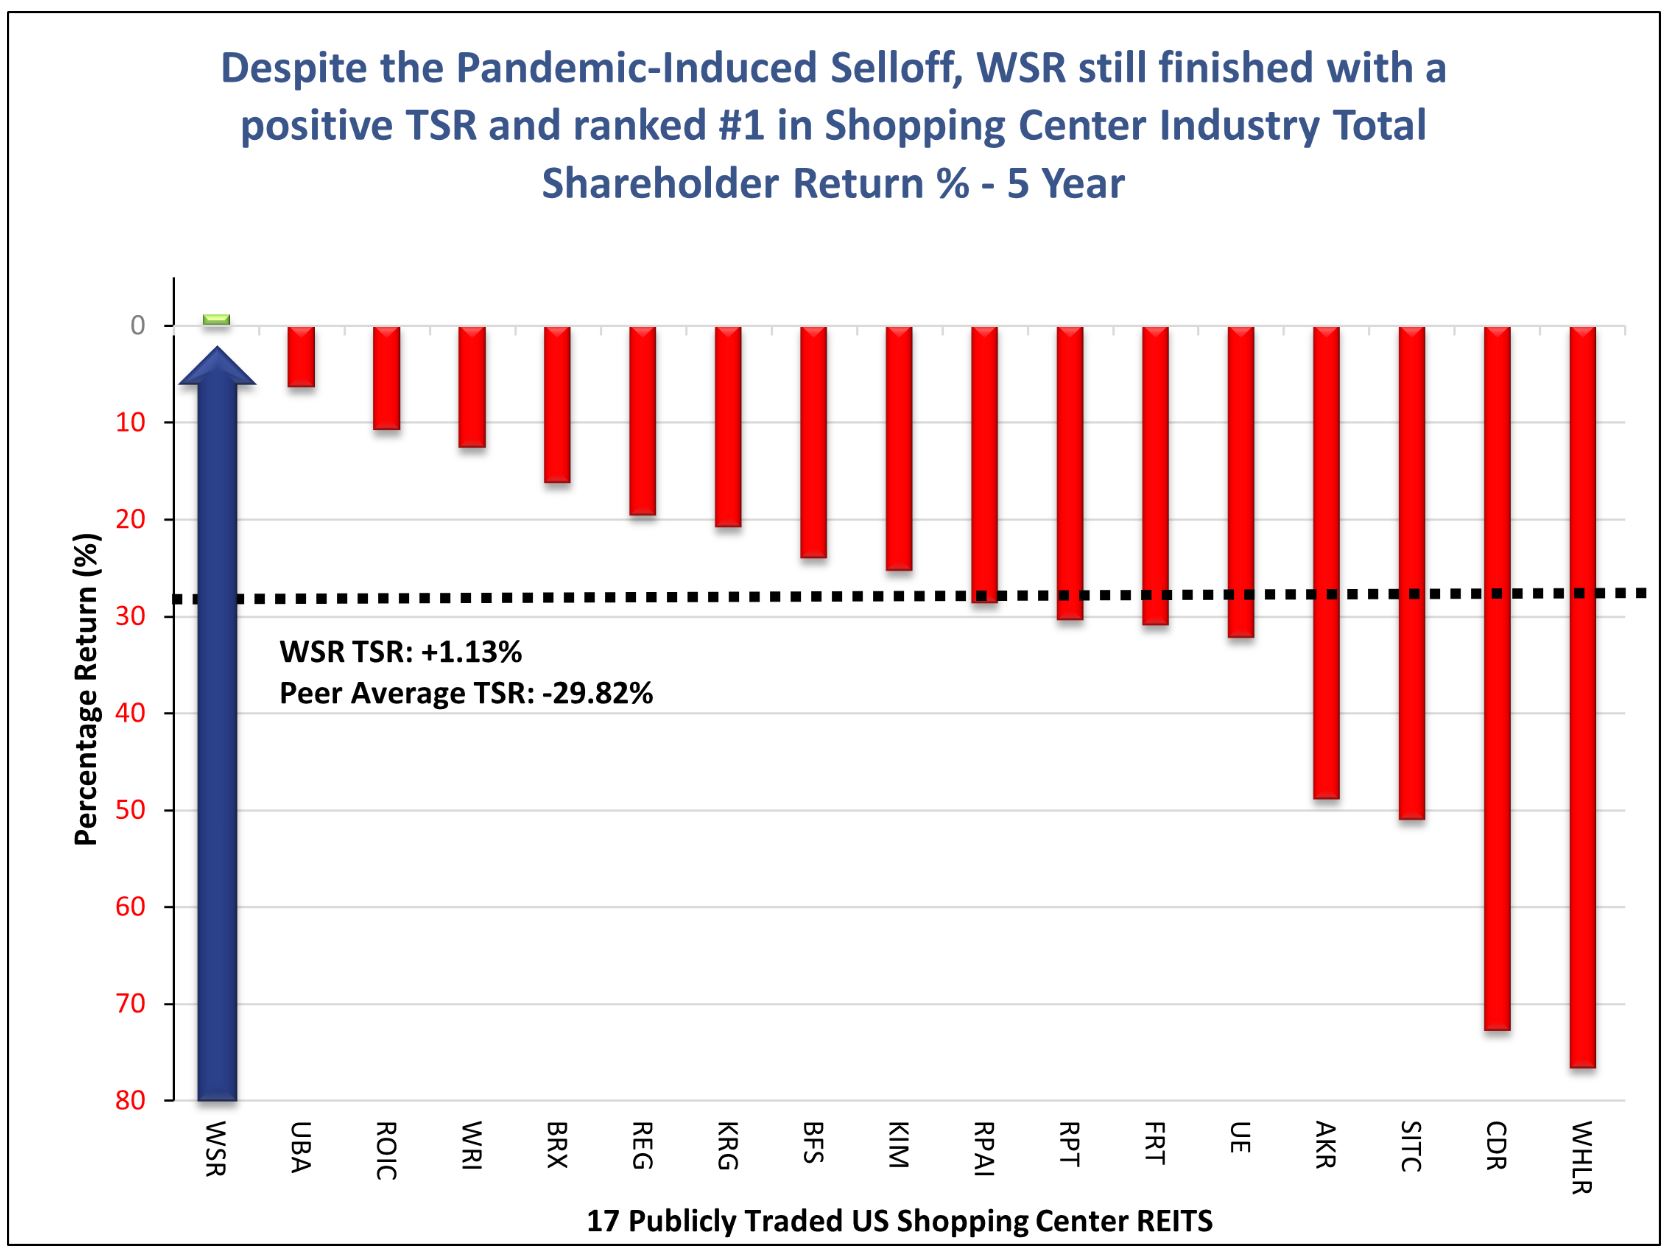
36
2020 Pay for Performance Decisions
The following table summarizes the decisions of the Compensation Committee in 20192020 versus 2018.2019. Our compensation philosophy is to pay at market median, with the majority of executive pay being aligned with companyCompany performance. When companyCompany and individual performance warrants, we may compensate above the market midpoint in variable pay components. Our independent compensation consultant analyzed the 20192020 compensation changes vs. the peer group and concluded the named executive officers’ 2020 total actual compensation was directly in line withat the 51st percentile of the peer group 50th percentile.group.
| Name | Base Salary | Annual Cash Incentive (1) | Long-term Stock Incentive | Total | Name | Base Salary | Annual Cash Incentives | Long-term Stock Incentives | Total | |||||||||||||||||||||||||||||||||
| ($) | ($) | ($) | ($) | |||||||||||||||||||||||||||||||||||||||
| 2018 | 2019 | 2018 | 2019 | 2018 | 2019 | 2018 | 2019 | 2020 | 2019 | 2020 | 2019 | 2020 | 2019 | 2020 | 2019 | |||||||||||||||||||||||||||
| Mr. Mastandrea | 600,000 | 600,000 | 750,000 | 750,000 | 2,000,000 | 2,000,000 | 3,350,000 | 3,350,000 | Mr. Mastandrea | 600,000 | 600,000 | 750,000 | — | 1,707,000 | 2,000,000 | 3,057,000 | 2,600,000 | |||||||||||||||||||||||||
| Mr. Holeman | 375,000 | 375,000 | 375,000 | 375,000 | 950,000 | 950,000 | 1,700,000 | 1,700,000 | Mr. Holeman | 375,000 | 375,000 | 375,000 | — | 853,500 | 950,000 | 1,603,500 | 1,325,000 | |||||||||||||||||||||||||
| Mr. Dee | 250,000 | 250,000 | 125,000 | 125,000 | 442,500 | 460,000 | 817,500 | 835,000 | Mr. Dee | 250,000 | 250,000 | 125,000 | — | 426,750 | 460,000 | 801,750 | 710,000 | |||||||||||||||||||||||||
| Mr. Johnson | 300,000 | 300,000 | 240,000 | 240,000 | 460,000 | 460,000 | 1,000,000 | 1,000,000 | Mr. Johnson | 300,000 | 300,000 | 240,000 | — | 426,750 | 460,000 | 966,750 | 760,000 | |||||||||||||||||||||||||
| Ms. Mastandrea | 300,000 | 300,000 | 240,000 | 240,000 | 460,000 | 460,000 | 1,000,000 | 1,000,000 | Ms. Mastandrea | 300,000 | 300,000 | 240,000 | — | 426,750 | 460,000 | 966,750 | 760,000 | |||||||||||||||||||||||||
Summary of Whitestone Compensation Practices
The Compensation Committee'sCommittee’s charter specifies its responsibility for establishing, implementing and continually monitoring our executive compensation programs. Additionally, the Compensation Committee is responsible for the assessment of executive compensation relative to Whitestone's performance, ensuring that the application of our compensation plans to specific executive incentive awards is justifiably appropriate, and making all compensation-related recommendations to our Board.
The material presented in this CD&A discusses (1) our executive compensation philosophy, strategy, process and procedures which are centered on a pay-for-performance philosophy and take into consideration the entrepreneurial approach required of our NEOs to build the Company and (2) all compensation components for our five NEOs, including a summary of the following:
•our overall compensation programs and characteristics;
•performance evaluation methodology and results;
•compensation plans adopted; and
•comparative market compensation assessment.
37
| Compensation Best Practices that We Follow | |||||
Pay for Performance - We tie pay to performance. In | |||||
Performance Based Long-Term Incentives - Historically we | |||||
Formulaic Short-Term Incentives - 100% of the NEOs’ annual incentive awards are based on rigorous objectively-determinable | |||||
Mitigate Undue Risk - We mitigate undue risk associated with compensation, including utilizing caps on potential payments, retention provisions, multiple performance targets, equity ownership guidelines and robust Board and management processes to identify risk. | |||||
Independent Compensation Consulting Firm - The Compensation Committee benefits from its utilization of an independent compensation consulting firm, which provides no other services to the Company. | |||||
Minimal Perquisites - We provide only minimal perquisites to our executive officers. | |||||
Regular Review of Share Utilization - Annually, we evaluate share utilization by reviewing overhang levels (dilutive impact of equity compensation on our shareholders) and annual run rates (the aggregate shares awarded as a percentage of total outstanding shares) to limit dilution to our shareholders while providing adequate market competitive compensation to employees. | |||||
Equity Ownership Guidelines - We require our trustees and NEOs to acquire and maintain prescribed levels of ownership of our shares in order to align their interests with those of our shareholders. | |||||
Review NEO Total Compensation - We compare the total compensation of our NEOs to that of our peers prior to making executive compensation decisions. | |||||
| Negative Compensation Practices That We Do Not Follow | |||||
| Repricing of Underwater Options | |||||
| Guaranteed Bonus or Retention Bonus for Executive Officers | |||||
| Severance Multipliers Greater Than 3X | |||||
| Automatic Share Reload (“Evergreen”) feature in Equity Incentive Plan | |||||
38
Compensation Strategy and Philosophy
Our corporate business model is based on the creation of Community Centered Properties® that are carefully tenanted and positioned to add value to the communities in which they are located. Our business model is entrepreneurial, involves a high degree of long-term planning, strategic thought and careful execution so that our properties effectively function as communities.
In allocating compensation, we believe the compensation of senior levels of management should be predominantly performance-based since these levels of management have the greatest ability to influence corporate performance. The table below summarizes the allocation of the 20192020 compensation opportunity for our NEOs and all other executives based upon the three primary elements of compensation (base- base salary, annual cash incentive, and long-term incentives).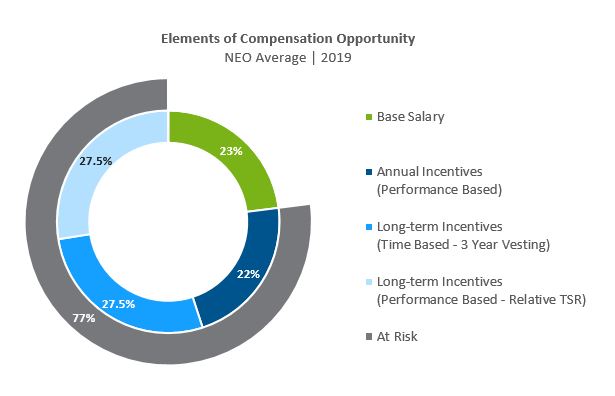
We generally aim to align with the market in each of the three pay elements as defined in our pay-for-performance philosophy.
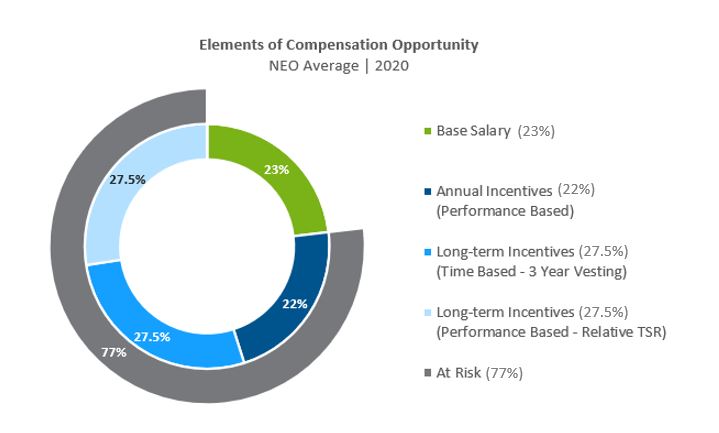
39
The three elements of 20192020 compensation are discussed in detail below.
Base Salary. The Compensation Committee's philosophy is to pay for performance, setting base salaries at the market median. Adjustments were made on January 1, 2018 to bring the NEOs to the 50th percentile. No salary adjustments were made to base salary for any of the NEOsNEOs’ base salaries in 2019.2020. Our independent compensation consultant analyzed the NEOs’ 2020 compensation compared to the peer group and concluded the NEOs’ 2020 base salaries were at the 39th percentile of the peer group.
| Name | Title | Base Salary ($) | % Change | |||||||||||
| 2019 | 2020 | |||||||||||||
| James C. Mastandrea | Chairman & CEO | 600,000 | 600,000 | — | ||||||||||
| David K. Holeman | CFO | 375,000 | 375,000 | — | ||||||||||
| John J. Dee | COO | 250,000 | 250,000 | — | ||||||||||
| Bradford D. Johnson | VP Acquisitions & Asset Mgmt | 300,000 | 300,000 | — | ||||||||||
| Christine J. Mastandrea | VP Corporate Strategy | 300,000 | 300,000 | — | ||||||||||
| Name | Title | Base Salary | % Change | |
| ($) | ||||
| 2018 | 2019 | |||
| James C. Mastandrea | Chairman & CEO | 600,000 | 600,000 | — |
| David K. Holeman | CFO | 375,000 | 375,000 | — |
| John J. Dee | COO | 250,000 | 250,000 | — |
| Bradford D. Johnson | VP Acquisitions & Asset Mgmt | 300,000 | 300,000 | — |
| Christine J. Mastandrea | VP Corporate Strategy | 300,000 | 300,000 | — |
Annual Cash Incentive. AnnualOur NEOs are eligible to receive annual cash incentives provideincentive awards under the Company's annual incentive program (the "AIP"). The AIP provides an opportunity for employees to receive a short-term award based on the achievement of specificspecified organization, operating and financial goals and objectives at the corporate level.
| 2020 Target Annual Incentive Award | |||||
| James C. Mastandrea | 125% of annual base salary, or $750,000 | ||||
| David K. Holeman | 100% of annual base salary, or $375,000 | ||||
| John J. Dee | 50% of annual base salary, or $125,000 | ||||
| Bradford D. Johnson | 80% of annual base salary, or $240,000 | ||||
| Christine J. Mastandrea | 80% of annual base salary, or $240,000 | ||||
40
The 20192020 annual incentive performance objectives, andweighting, targets, and actual 2019the 2020 performance wasresults under the AIP were as follows:
| 2019 Objective | Multiple of Target | |
| FFO Core Per Share (30%) | ||
| $1.15 | Exceptional | 2.00 |
| $1.10 | Stretch | 1.50 |
| $1.08 | Target | 1.00 |
| $1.06 | Low | 0.50 |
| 2019 Actual Achievement - $1.06 | ||
| Occupancy @ 12/31/2019 (15%) | ||
| 93% | Exceptional | 2.00 |
| 92% | Stretch | 1.50 |
| 91% | Target | 1.00 |
| 90% | Low | 0.50 |
| 2019 Actual Achievement - 90.3% | ||
| Same Store NOI Growth (15%) | ||
| 4% | Exceptional | 2.00 |
| 3% | Stretch | 1.50 |
| 2% | Target | 1.00 |
| 1% | Low | 0.50 |
| 2019 Actual Achievement - 0.505% | ||
| Debt to EBITDA Ratio (10%) | ||
| 8.0X | Exceptional | 2.00 |
| 8.2X | Stretch | 1.50 |
| 8.4X | Target | 1.00 |
| 8.6X | Low | 0.50 |
| 2019 Actual Achievement - 8.602X | ||
| G&A Expenses as a % of Total Revenue (10%) | ||
| 16.0% | Exceptional | 2.00 |
| 16.5% | Stretch | 1.50 |
| 17.0% | Target | 1.00 |
| 17.5% | Low | 0.50 |
| 2019 Actual Achievement - 16.7% | ||
| Dividend/AFFO (10%) | ||
| 125% | Exceptional | 2.00 |
| 128% | Stretch | 1.50 |
| 131% | Target | 1.00 |
| 134% | Low | 0.50 |
| 2019 Actual Achievement - 146% | ||
| Dividend minus available for distribution (10%) | ||
| ($4,584,509) | Exceptional | 2.00 |
| ($5,584,509) | Stretch | 1.50 |
| ($6,584,509) | Target | 1.00 |
| ($7,584,509) | Low | 0.50 |
| 2019 Actual Achievement - ($14,916,000) | ||
| 2020 Objective and Weighting | Multiple of Target | |||||||
| Liquidity (Cash + Available under Credit Facility (50%) | ||||||||
| $25,000,000 | Exceptional | 2.00 | ||||||
| $23,000,000 | Stretch | 1.50 | ||||||
| $20,000,000 | Target | 1.00 | ||||||
| $19,000,000 | Low | 0.50 | ||||||
| 2020 Performance Result - $42,144,000 | 2.00 | |||||||
| Occupancy @ 12/31/2020 (25%) | ||||||||
| 86% | Exceptional | 2.00 | ||||||
| 85% | Stretch | 1.50 | ||||||
| 84% | Target | 1.00 | ||||||
| 82% | Low | 0.50 | ||||||
| 2020 Performance Result - 88.2% | 2.00 | |||||||
| Dividend / AFFO (25%) | ||||||||
| 85% | Exceptional | 2.00 | ||||||
| 95% | Stretch | 1.50 | ||||||
| 100% | Target | 1.00 | ||||||
| 125% | Low | 0.50 | ||||||
| 2020 Performance Result - 75.9% | 2.00 | |||||||
Because the Company achieved each of the three 2020 targets at the Exceptional level, each NEO was potentially eligible to receive his or her annual incentive award at 200% of the target amount. Historically, the Compensation Committee has refrained from exercising discretion to modify cash incentives payable under the AIP. Despite the fact that the 2020 performance targets were established at the height of the COVID-19 pandemic and that the Company and our executive officers performed at an Exceptional level in 2020, in light of the impact of the pandemic, the Compensation Committee and the Board exercised their discretion to reduce the cash incentives payable to each NEO to the Target level rather than 200% of target.
Our independent compensation consultant analyzed the 2020 compensation compared to the peer group and concluded the NEOs’ 2020 target and actual total cash compensation amounts were at the 44th 2019 includes pro rata shareand 57th percentile of unconsolidated real estate partnership.our peer group, respectively.
Long-Term Equity Incentive Ownership Plan. Our 2008 Plan expired on July 29, 2018, and our 2018 Plan became effective on July 30, 2018. Our 2018 Plan provides for equity-based grants of incentive compensation to our NEOs and other employees and provideprovides an opportunity for our employees to receive grants of equity that vest over time or upon the achievement of long-term goals that create incremental value for the Company and our shareholders. Our 2018 Plan is designed to encourage entrepreneurship and align the interests of our NEOs and employees with our long-term strategy. The Compensation Committee considers these awards to be the most important component of total compensation and key retention of participants because they encourage participants to think and act like owners. Our independent compensation consultant analyzed the 2020 compensation compared to the peer group and concluded that the grant date fair value of our NEOs’ 2020 target long-term incentive awards was at the 53rd percentile of our peer group.
•In 2019,For 2020, 50% of each NEO’s restricted common share unit awards contained vesting conditions tied tounits granted under the 2018 Plan vest based on our TSR relative to that of the peer group defined in the TSR Unit award agreements over a three-year performance period from January 1, 20192020 through December 31, 20212022 (the “TSR Units”). At the end of the performance period, the number of common shares awarded will be a multiple of the number of units granted based on the Company'sCompany’s ranking in the peer group (the “TSR Peer Group Ranking”) as shown in the table below. Continued employment is required through the end of the performance period.
41
•The remaining 50% of theeach NEO’s restricted common share unit awardsunits granted in 2020 under the 2018 Plan vest based on continued employment over three years. Vesting occurs annually over the three years in equal increments on June 30, 2020,July 31, 2021, 2022 and 20222023 (the “Time-Based Units”).
The TSR Unit vesting schedule is as follows:
| TSR Unit Vesting Schedule | |||||
| Three Year Relative TSR Performance Rank | Multiple | ||||
| 90th | 2.0 | ||||
| 75th | 1.5 | ||||
| 50th | 1.0 | ||||
| 35th | 0.5 | ||||
| Less than 35th | 0.0 | ||||
The following table illustrates the total grant date fair value (“GDFV”) of the Time-Based Units and TSR Units:
| 2020 Annual Incentive Equity Grants | |||||||||||||||||
| Name | Number of Time-Based Units (#) | Grant Date Fair Value of Time-Based Units (1) ($) | Target Number of TSR Units (#) | Grant Date Fair Value of TSR Units (1) ($) | Total Grant Date Fair Value of Stock Awards(1) ($) | ||||||||||||
| James C. Mastandrea | 150,000 | 874,500 | 150,000 | 832,500 | 1,707,000 | ||||||||||||
| David K. Holeman | 75,000 | 437,250 | 75,000 | 416,250 | 853,500 | ||||||||||||
| John J. Dee | 37,500 | 218,625 | 37,500 | 208,125 | 426,750 | ||||||||||||
| Bradford Johnson | 37,500 | 218,625 | 37,500 | 208,125 | 426,750 | ||||||||||||
| Christine J. Mastandrea | 37,500 | 218,625 | 37,500 | 208,125 | 426,750 | ||||||||||||
| 2019 Annual Incentive Equity Grants | |||||
| Name | Time-Based Units (#) | Grant Date Fair Value of Time-Based Units (1) ($) | Target TSR Units (#) | Grant Date Fair Value of TSR Units (1) ($) | Total (1) ($) |
| James C. Mastandrea | 94,073 | 1,000,000 | 121,655 | 1,000,000 | 2,000,000 |
| David K. Holeman | 44,685 | 475,000 | 57,786 | 475,000 | 950,000 |
| John J. Dee | 21,637 | 230,000 | 27,981 | 230,000 | 460,000 |
| Bradford Johnson | 21,637 | 230,000 | 27,981 | 230,000 | 460,000 |
| Christine J. Mastandrea | 21,637 | 230,000 | 27,981 | 230,000 | 460,000 |
(1)The grant date fair value for each Time-Based Unit of $5.83 was determined in accordance with ASC Topic 718, utilizing the assumptions discussed in Note 15 to our audited financial statements for the year ended December 31, 2020 as included in our 2020 Annual Report filed with the SEC on March 8, 2021. The grant date fair value for each TSR Unit of $5.55 was determined using the Monte Carlo simulation method and is being recognized as share-based compensation expense ratably from the July 31, 2020 grant date to the end of the performance period, December 31, 2022. The Monte Carlo simulation model utilizes multiple input variables that determine the probability of satisfying the market condition stipulated in the award grant and calculates the fair value of the award. Expected volatilities utilized in the model were estimated using a historical period consistent with the performance period of approximately three years. The risk-free interest rate was based on the United States Treasury rate for a term commensurate with the expected life of the grant.
Hedging. The Company does not have any policies or practices regarding hedging or disclose any hedging policies and practices for employees, offices,officers, and trustees.
Compensation Objectives
| Objective | Compensation Elements Designed to Meet Objective | ||||
| Compensation should be linked to performance. | A significant portion of each NEO's pay opportunity relates to the performance-based awards granted pursuant to the 2008 Plan and the 2018 Plan, which will vest based on achievement of performance targets. | ||||
| Compensation should be fair and competitive. | We believe that our compensation is fair and | ||||
| Executive share ownership is required. | Our long-term incentive award program is a key means by which executives are rewarded for financial performance. As the awards vest, we expect our executives will retain a significant number of their vested shares in accordance with our share ownership guidelines. As of December 31, | ||||
| The Compensation Committee and the Board exercise independent judgment. | On behalf of our shareholders, the Compensation Committee and the Board ensure that executive compensation is appropriate and effective, and that all assessments, engagement of advisors, analysis, discussion, rationale and decision making are through the exercise of independent judgment. | ||||
Roles and Responsibilities in Compensation Decisions
The Compensation Committee is specifically responsible for compensation decisions related to our Chief Executive Officer. The Compensation Committee reviews, assesses and approves recommendations from our Chief Executive Officer regarding any determination of base salary and annual cash incentives to all other officers, including the other NEOs. The Compensation Committee'sCommittee’s philosophy and strategy and the programs adopted by our Board establish the general parameters within which our Chief Executive Officer recommends compensation for the other NEOs.
James C. Mastandrea, our Chairman and Chief Executive Officer, annually reviews the performance of our other officers. The conclusions reached and recommendations made based on these reviews, including base salary adjustments as well as annual cash incentives, are presented to the Compensation Committee. The Compensation Committee can exercise its discretion in modifying any recommended salary adjustment or annual cash incentive award.
The Compensation Committee also evaluates the performance of our NEOs and performs an assessment of market compensation for the NEOs and the general market conditions as related to compensation policy and practices in the industry and among our competitors. This information is used by the Compensation Committee to review the Company'sCompany’s current pay programs and levels and to address questions related to effective compensation plans and associate retention.
Setting Executive Compensation
Based on the strategy and philosophy and the objectives described above, the Compensation Committee has structured our annual and long-term executive compensation programs to motivate and reward executive officers in the achievement of our business goals.
As a part of the compensation decision making process, the Compensation Committee compares each element comprising total compensation for our NEO positions against similar positions in a peer group of other REITs (the “Compensation Peer Group”). The Compensation Committee used the SEC filings of the Compensation Peer Group to assist it in considering compensation for our NEOs. Among other items, the SEC filings providedprovide company specific, sector specific and position specific compensation information including base salary, total annual cash compensation and long-term compensation. The Compensation Committee relied on this data to provide it with relevant market compensation data for our NEOs compared to the Compensation Peer Group in order to make compensation decisions for our NEOs. The Compensation Peer Group, which was analyzed and updated in 20192020 by the Compensation Committee, consists of companies with whom we believe we compete for talent, investment opportunities, and shareholder investment dollars.
In determining the appropriate Compensation Peer Group for 2019,2020, the Compensation Committee utilized its compensation consultant to conduct a comprehensive analysis of the public market to identify peer companies. As part of that review, we reviewed the peer group identified in Whitestone’s 2018 proxy statement and identified potential peer candidates usingused the following criteria:
◦Public real estate companies structured as equity REITs that own, invest, manage and develop real estate assets similar to us through an integrated and self-managed operating platform,
◦Companies of similar size,
◦Companies in the retail REIT industry,
◦Companies with similar financial metrics. Specifically, we looked for companies with financial metrics that were within a range of 50% to 3 times our market capitalization, enterprise value, total assets, annual revenue and EBITDA.
We also reviewed the oneone-year and three-year total shareholder return (“TSR”)TSR to exclude any poor performers who appear to be financially struggling (large negative TSR, large negative EBITDA, oversized debt to market capitalization, etc.).
Additionally, we analyzed the ISSInstitutional Shareholder Services (“ISS”) selected peer group and the SNL peer groupUS Shopping Center Index to further identify any potential REITs that could be similar in financial size, retail sector and performance.
We compete with many companies for experienced executives, and the Compensation Committee generally benchmarked compensation for the NEOs against the compensation paid to similarly situated executives of the companies comprisingin the Compensation Peer Group. Variations may be expected based on relative experience levels, market factors, and circumstances particular to us.
44
A total of 15 public companies were used in the Compensation Committee analysis for 20192020 and are listed below. All numbers are shown in millions and are as of January 20, 2020 using22, 2021 based on the most recent public filing.filings.
| Company Name | Ticker | Revenue (1) | Market Cap (2) | Assets (1) | Net Income (1) | 1-Yr TSR (3) | 3-Yr TSR (3) | Company Name | Ticker | Revenue (1) | Market Cap (2) | Assets (1) | Net Income (1) | 1-Yr TSR (3) | 3-Yr TSR (3) | |||||||||||||||
| Acadia Realty Trust | AKR | $290 | $2,300 | $4,330 | $39 | 1% | (10)% | Acadia Realty Trust | AKR | $264 | $1,414 | $4,251 | $23 | (38)% | (32)% | |||||||||||||||
| Agree Realty Corporation | ADC | $184 | $3,087 | $2,523 | $71 | 22% | 77% | Agree Realty Corporation | ADC | $229 | $4,083 | $3,548 | $90 | (7)% | 45% | |||||||||||||||
| Armada Hoffler Properties, Inc | AHH | $219 | $1,435 | $1,761 | $29 | 35% | 53% | Armada Hoffler Properties, Inc | AHH | $367 | $918 | $1,841 | 40 | (35)% | (7)% | |||||||||||||||
| Cedar Realty Trust, Inc. | CDR | $145 | $242 | $1,223 | $16 | (10)% | (48)% | Cedar Realty Trust, Inc. | CDR | $138 | $155 | $1,198 | $(17) | (35)% | (63)% | |||||||||||||||
| Clipper Realty, Inc. | CLPR | $113 | $474 | $1,138 | -$1 | (16)% | - | Clipper Realty, Inc. | CLPR | $122 | $324 | $1,223 | $(5) | (27)% | (18)% | |||||||||||||||
| Getty Realty Corp. | GTY | $140 | $1,340 | $1,194 | $49 | 11% | 44% | Getty Realty Corp. | GTY | $146 | $1,163 | $1,324 | $49 | 12% | 20% | |||||||||||||||
| Investors Real Estate Trust | IRET | $188 | $856 | $1,404 | $35 | 35% | 24% | Investors Real Estate Trust | IRET | $178 | $946 | $1,479 | $58 | - | - | |||||||||||||||
| Kite Realty Group Trust | KRG | $338 | $1,571 | $2,936 | -$23 | 24% | (4)% | Kite Realty Group Trust | KRG | $274 | $1,464 | $2,658 | $6 | (2)% | 17% | |||||||||||||||
| Monmouth Real Estate Investment Corporation | MNR | $159 | $1,422 | $1,872 | $30 | 17% | 12% | Monmouth Real Estate Investment Corporation | MNR | $168 | $1,759 | $1,940 | $(22) | 29% | 19% | |||||||||||||||
| One Liberty Properties, Inc. | OLP | $83 | $559 | $785 | $13 | 14% | 40% | One Liberty Properties, Inc. | OLP | $85 | $428 | $787 | $29 | (18)% | 2% | |||||||||||||||
| Pennsylvania Real Estate Investment Trust | PEI | $344 | $402 | $2,334 | -$75 | (21)% | (62)% | Pennsylvania Real Estate Investment Trust | PEI | $284 | $148 | $2,365 | $(79) | (60)% | (79)% | |||||||||||||||
| RPT Realty | RPT | $240 | $1,206 | $1,866 | $15 | 26% | 11% | RPT Realty | RPT | $202 | $796 | $1,984 | $68 | (2)% | (17)% | |||||||||||||||
| Retail Opportunities Investments Corp. | ROIC | $297 | $2,193 | $2,933 | $49 | 7% | (6)% | Retail Opportunities Investments Corp. | ROIC | $285 | $1,856 | $2,921 | $33 | (14)% | (14)% | |||||||||||||||
| Saul Centers Inc. | BFS | $234 | $1,665 | $1,647 | $51 | 9% | (7)% | Saul Centers Inc. | BFS | $224 | $998 | $1,681 | $44 | (36)% | (35)% | |||||||||||||||
| Urstadt Biddle Properties Inc. | UBA | $138 | $885 | $1,072 | $37 | 25% | 21% | Urstadt Biddle Properties Inc. | UBA | $127 | $547 | $1,010 | $22 | (36)% | (14)% | |||||||||||||||
| WHITESTONE REIT | WSR | $119 | $566 | $1,012 | $16 | 6% | 30% | WHITESTONE REIT | WSR | $118 | $363 | $1,065 | $19 | (34)% | (21)% | |||||||||||||||
25th Percentile | $140 | $559 | $1,194 | $13 | 1% | -8% | 25th Percentile | $138 | $428 | $1,223 | $(5) | (36)% | (32)% | |||||||||||||||||
| Average | $207 | $1,309 | $1,935 | $22 | 12% | 10% | Average | $206 | $1,133 | $2,014 | $23 | (23)% | (12)% | |||||||||||||||||
50th Percentile | $188 | $1,340 | $1,761 | $30 | 14% | 12% | 50th Percentile | $202 | $946 | $1,841 | $29 | (30)% | (14)% | |||||||||||||||||
75th Percentile | $290 | $1,665 | $2,523 | $49 | 25% | 41% | 75th Percentile | $274 | $1,464 | $2,658 | $49 | (11)% | 17% | |||||||||||||||||
| Whitestone REIT Percentile Rank | 14% | 25% | 18% | 38% | 31% | 69% | Whitestone REIT Percentile Rank | 12% | 21% | 14% | 36% | 42% | 32% | |||||||||||||||||
(1) Source: SNL FinancialS&P Global - In each case, as of the company's most recent quarter (trailing twelve months for revenue and net income).
(2) Source: SNL FinancialS&P Global - In each case, based on traded market price on January 20, 20202021 multiplied by the number of shares outstanding.
(3) Source: SNL FinancialS&P Global
The Compensation Committee will continue to review a variety of information, including that provided by compensation consultants, as necessary, in the future to determine the appropriate level and mix of incentive compensation including benchmarking total NEO compensation to the peer group. See “2019020 Pay for Performance Decisions.”
45
Compensation Related Risk Management
Our incentive compensation programs are largely tied to objectively determinable financial and operating results and by the behavior and decisions of management. As a part of compensation administration, the Compensation Committee must take an oversight role to monitor the actions of management to ensure that the incentive programs are not creating an environment of excessive risk taking which could be detrimental to shareholders. This “risk management” aspect of the Compensation Committee's responsibility is an evolving duty and focus. The Compensation Committee has reviewed the elements of compensation to determine whether they encourage excessive risk taking and concluded that any risks arising from the Company’s compensation policies and practices for its employees are not reasonably likely to have a material adverse effect on the Company. The Compensation Committee has also taken certain steps to establish policies and procedures, including limits on expenditures and a robust Board-level Investment Committee approval process, thatwhich we believe are likely to limit and manage the risk of management actions as well as measure and monitor business activities that can indicate risk and risk management needs. The combined experience of our NEOs, the length of time they have worked together, and the relatively smaller size of our Company at this time makes these risk management policies easier to manage. However, as the Company grows, the Compensation Committee will consider and adopt policies as needed to continue to ensure that decisions associated with incentive compensation opportunity do not exceed the intended risk level of the Company.
Employment and Change in Control Agreements
On August 29, 2014, based on the recommendation of the Compensation Committee and approval of the Board, the Company entered into employment agreements with Messrs. Mastandrea and Holeman, largely in recognition of the need to provide them certain protections if their employment should be involuntarily terminated without “cause” or terminated by them for “good reason.” The Company also entered into change in control agreements with the other NEOs on August 29, 2014.
On February 4, 2021, the Compensation Committee and the Board amended the employment agreements for Messrs. Mastandrea and Holeman and the change in control agreements for Ms. Mastandrea and Messrs. Dee and Johnson in order to clarify that the Board’s reduction in 2020 cash incentive payouts will be disregarded for purposes of any severance or change in control entitlements, and approved retention payments for our NEOs, payable on March 15, 2025, subject to the NEO’s continued employment with the Company through December 31, 2024 (with exceptions for terminations by the Company without cause, by the NEO for good reason or due to death or disability). The amounts of such retention payments for Messrs. Mastandrea, Holeman, Dee and Johnson and Ms. Mastandrea are $750,000, $375,000, $125,000, $240,000 and $240,000, respectively.
These change in control agreements are designed to compensate the NEOs in the event of a fundamental change in the Company, and to provide an incentive to these executives to continue with us at least through such time. A more complete description of the employment agreements and change in control agreements is set forth under “Executive Compensation - Employment Agreements; Payments Upon Change in Control.” We believe that these agreements will help us to retain executives who are essential to our long-term success, and that the terms of these agreements are consistent with the practices of our peer companies.
Perquisites and Other Personal Benefits
We provide our NEOs with benefits and other personal perquisites that we deem reasonable and consistent with our overall compensation program. Such benefits enable us to attract and retain superior employees for key positions. The Compensation Committee periodically reviews our overall compensation program and specific perquisites provided to the NEOs.
Chief Executive Officer Compensation and Employee Compensation and Pay Ratio
Pursuant to Section 953(b) of the Dodd-Frank Wall Street Reform and Consumer Protection Act (“Dodd-Frank”Dodd-Frank”) and in accordance with Item 402(u) of Regulation S-K, we have estimated the ratio between the total annual compensation of our Chief Executive Officer’s total compensationOfficer and the median of the annual total compensation of all employees (excluding the Chief Executive Officer). In searching for the “median employee,” we considered taxable compensation totals in 2019. We identified the median employeerepresentative “median employee” based on the taxable compensation of all full-time, part-time and temporary employees employed by us on December 31, 2019,2020, then we calculated the median employee’s compensation using the same methodology we use for our NEOs as set forth in the “Total” column in the Summary Compensation Table below. This is the same methodology we used for the 20182019 pay ratio. For the fiscal year ended December 31, 2019,2020, our Chief Executive Officer had annual total compensation of $2,617,875,$3,088,683 and our median employee had annual total compensation of $66,459.$63,359. Therefore, we estimate that our Chief Executive Officer’s annual total compensation is approximately 3949 times that of the median of the annual total compensation of all of our employees (excluding the Chief Executive Officer).
Compensation Committee Interlocks and Insider Participation
The Compensation Committee is currently comprisedcomposed of Messrs. Jones, Lambert, Mahaffey and Taylor, with Mr. Lambert serving as chairman. None of the members of the Compensation Committee during 20192020 is or has served as an officer or employee for us and none of our executive officers has served on the board of directors or compensation committee of any company whose executive officers served on the Compensation Committee or our Board.
Compensation Consultant
To support the Compensation Committee in fulfilling its duties, the Compensation Committee directly retained an external compensation consultant to assist with its design and evaluation of compensation for our executive officers and trustees. Pursuant to its charter, the Compensation Committee shall retain, as deemed necessary or appropriate by the Compensation Committee, any compensation consultant, independent legal counsel or other compensation advisor and shall approve the advisor’s fees and other retention terms.
In January 2019,2020, the Compensation Committee retained Longnecker & Associates (“Longnecker”) to provide executive officer and trustee compensation consulting services. During fiscal year 2019,2020, Longnecker did not provide any additional services to the Company or the Company's affiliates.
Based upon and following receipt of the advice of Longnecker, the Compensation Committee reviewed and approved the Company’s goals and objectives relevant to Chief Executive Officer and executive compensation and the compensation payable to our Chief Executive Officer and other executive officers for fiscal year 2019.2020.
As required by its charter and by the NYSE listing standards, the Compensation Committee performed an independence assessment of Longnecker and determined that Longnecker should be considered independent based on the following factors:
•Longnecker has not provided and will not provide any other services to the Company other than compensation consulting services.
•The fees paid to Longnecker by the Company were less than 1% of Longnecker's total revenue for the year.
•Longnecker has developed and provided to the Company a Conflict of Interest Policy.
•There are no business or personal relationships between Longnecker and any member of the Compensation Committee or any executive officer of the Company.
Accordingly, the Compensation Committee determined that the services provided by Longnecker to the Compensation Committee did not give rise to any conflicts of interest.
47
COMPENSATION COMMITTEE REPORT
The Compensation Committee has reviewed and discussed the Compensation Discussion and Analysis section of this Proxy Statement with management and, based on such review and discussions, the Compensation Committee has recommended to the Board that the Compensation Discussion and Analysis be included in this Proxy Statement and Whitestone's Annual Report on Form 10-K.
Respectfully submitted,
Whitestone REIT Compensation Committee
Paul T. Lambert, Chairman
Jeffrey A. Jones
Jack L. Mahaffey
David F. Taylor
The information contained in the report above shall not be deemed to be “soliciting material” or to be “filed” with the SEC, nor shall such information be incorporated by reference into any future filing under the Securities Act of 1933, as amended (the “Securities Act”), or the Exchange Act, except to the extent specifically incorporated by reference therein.
48
EXECUTIVE COMPENSATION
Summary Compensation Table
The table below summarizes the total compensation paid by the Company to each of our NEOs in 2017, 2018, 2019 and 2019.2020.
| Name and Principal Position | Year | Salary | Bonus | Share Awards | Non-equity Incentive Plan Compensation (4) | All Other Compensation | Total | ||||||||||||||||||||||
| ($) | ($) | ($) | ($) | ($) | ($) | ||||||||||||||||||||||||
| James C. Mastandrea, Chairman & Chief Executive Officer | 2020 | 600,000 | __ | 1,707,000 | (1) | 750,000 | 31,683 | (5) | 3,088,683 | ||||||||||||||||||||
| 2019 | 600,000 | __ | 2,000,000 | (2) | __ | 17,875 | (5) | 2,617,875 | |||||||||||||||||||||
| 2018 | 600,000 | __ | 2,000,000 | (3) | __ | 19,245 | (5) | 2,619,245 | |||||||||||||||||||||
| David K. Holeman, Chief Financial Officer | 2020 | 375,000 | __ | 853,500 | (1) | 375,000 | 21,919 | (6) | 1,625,419 | ||||||||||||||||||||
| 2019 | 375,000 | __ | 950,000 | (2) | __ | 16,977 | (6) | 1,341,977 | |||||||||||||||||||||
| 2018 | 375,000 | __ | 950,000 | (3) | __ | 17,371 | (6) | 1,342,371 | |||||||||||||||||||||
| John J. Dee, Chief Operating Officer | 2020 | 250,000 | __ | 426,750 | (1) | 125,000 | 13,628 | (6) | 815,378 | ||||||||||||||||||||
| 2019 | 250,000 | __ | 460,000 | (2) | __ | 13,927 | (6) | 723,927 | |||||||||||||||||||||
| 2018 | 250,000 | — | 442,500 | (3) | — | 12,326 | (6) | 704,826 | |||||||||||||||||||||
| Bradford D. Johnson, EVP Acquisitions and Asset Management | 2020 | 300,000 | __ | 426,750 | (1) | 240,000 | 4,808 | (7) | 971,558 | ||||||||||||||||||||
| 2019 | 300,000 | __ | 460,000 | (2) | __ | 4,442 | (7) | 764,442 | |||||||||||||||||||||
| 2018 | 300,000 | — | 460,000 | (3) | — | 9,625 | (7) | 769,625 | |||||||||||||||||||||
| Christine J. Mastandrea, EVP Corporate Strategy | 2020 | 300,000 | __ | 426,750 | (1) | 240,000 | 9,975 | (7) | 976,725 | ||||||||||||||||||||
| 2019 | 300,000 | __ | 460,000 | (2) | __ | 9,692 | (7) | 769,692 | |||||||||||||||||||||
| 2018 | 300,000 | — | 460,000 | (3) | — | 9,625 | (7) | 769,625 | |||||||||||||||||||||
| Name and Principal Position | Year | Salary | Bonus | Share Awards | All Other Compensation | Total | |||||||
| ($) | ($) | ($) | ($) | ($) | |||||||||
| James C. Mastandrea, Chairman & Chief Executive Officer | 2019 | 600,000 | 2,000,000 | (1) | 17,875 | (4) | 2,617,875 | ||||||
| 2018 | 600,000 | __ | 2,000,000 | (2) | 19,245 | (4) | 2,619,245 | ||||||
| 2017 | 400,000 | __ | 1,000,000 | (3) | 16,972 | (4) | 1,416,972 | ||||||
| David K. Holeman, Chief Financial Officer | 2019 | 375,000 | __ | 950,000 | (1) | 16,977 | (5) | 1,341,977 | |||||
| 2018 | 375,000 | __ | 950,000 | (2) | 17,371 | (5) | 1,342,371 | ||||||
| 2017 | 250,000 | __ | 475,000 | (3) | 12,794 | (5) | 737,794 | ||||||
| John J. Dee, Chief Operating Officer | 2019 | 250,000 | __ | 460,000 | (1) | 13,927 | (5) | 723,927 | |||||
| 2018 | 250,000 | — | 442,500 | (2) | 12,326 | (5) | 704,826 | ||||||
| 2017 | 225,000 | 5,000 | 275,150 | (3) | 7,975 | (5) | 513,125 | ||||||
| Bradford D. Johnson, EVP Acquisitions and Asset Management | 2019 | 300,000 | __ | 460,000 | (1) | 4,442 | (6) | 764,442 | |||||
| 2018 | 300,000 | — | 460,000 | (2) | 9,625 | (6) | 769,625 | ||||||
| 2017 | 225,000 | 5,000 | 292,650 | (3) | 6,713 | (6) | 529,363 | ||||||
| Christine J. Mastandrea, EVP Corporate Strategy | 2019 | 300,000 | __ | 460,000 | (1) | 9,692 | (6) | 769,692 | |||||
| 2018 | 300,000 | — | 460,000 | (2) | 9,625 | (6) | 769,625 | ||||||
| 2017 | 225,000 | 5,000 | 295,650 | (3) | 6,713 | (6) | 532,363 | ||||||
(2)Represents the grant date fair value of 121,655, 57,786, 27,981, 27,981and 27,981 TSR Units granted to Messrs. Mastandrea, Holeman, Dee, and Johnson and Ms. Mastandrea, respectively, and 94,073, 44,685, 21,637, 21,637 and 21,637 Time-Based Units granted to Messrs. Mastandrea, Holeman, Dee, and Johnson and Ms. Mastandrea, respectively. The grant date fair values disclosed in the table were calculated in accordance with Financial Accounting Standards Board Accounting Standards Codification, or ASC, Topic 718, “Compensation-Stock Compensation,” utilizing the assumptions discussed in Note 15 to our audited financial statements for the year ended December 31, 2019 as included in our 2019 Annual Report filed with the SEC on March 2, 2020 and are based on performance at target. The Time-Based Units were granted under the 2018 Plan in 2019, the vesting of which is contingent upon the passage of time and vest in equal installments on June 30, 2020, 2021 and 2022. Maximum performance under the TSR Units would result in an additional grant date fair value of $1,000,000, $475,000, $230,000, $230,000 and $230,000 to Messrs. Mastandrea, Holeman, Dee and Johnson and Ms. Mastandrea, respectively.
49
(3)Represents the grant date fair value of 67,159, 31,901, 15,447, 15,447and 15,447 TSR Units to Messrs. Mastandrea, Holeman, Dee, and Johnson and Ms. Mastandrea, respectively, and 114,416, 54,348, 24,314, 26,316 and 26,316 Time-Based Units to Messrs. Mastandrea, Holeman, Dee, and Johnson and Ms. Mastandrea, respectively. The grant date fair values disclosed in the table were calculated in accordance with Financial Accounting Standards Board Accounting Standards Codification, or ASC, Topic 718, “Compensation-Stock Compensation,” utilizing the assumptions discussed in Note 15 to our audited financial statements for the year ended December 31, 2018 as included in our 2018 Annual Report filed with the SEC on March 15, 2019 and are based on performance at target. The Time-Based Units were granted under the 2018 Plan in 2018, the vesting of which is contingent upon the passage of time and vest in equal installments on March 16, 2019, 2020 and 2021. Maximum performance under the TSR Units would result in an additional grant date fair value of $1,000,000, $475,000, $230,000, $230,000 and $230,000 to Messrs. Mastandrea, Holeman, Dee and Johnson and Ms. Mastandrea, respectively.
(4)Represents annual incentive compensation earned in 2020 under the AIP by each executive.
(5)Represents (a) the incremental cost of a Whitestone automobile not used exclusively for business purposes, (b) matching contributions under our 401(k) plan and (c) health insurance.
(6)Represents (a) the incremental cost of a Whitestone automobile not used exclusively for business purposes, and (b) matching contributions under our 401(k) plan.
(7)Represents matching contributions under our 401(k) plan.
50
Grants of Plan Based Awards
The following table sets forth certain information with respect to annual cash incentive award opportunities (“ACA”), time-based restricted common share unit grants (“TB Grants”)granted to each NEO under the AIP, and performance-based restricted common share unit grants (“the Time-Based Units and TSR Grants”)Units granted to each NEO during the year ended December 31, 2019 for each NEO.2020.
Estimated Future Payouts Under Nonequity Incentive Plan Awards (1) | Estimated Future Payouts Under Equity Incentive Plan Awards (2) | All Other Stock Awards: Number of Shares or Units (3) (#) | Grant Date Fair Value of Stock Awards (4) ($) | |||||||||||||||
| Name | Grant Date | Description | Threshold ($) | Target ($) | Maximum ($) | Threshold (#) | Target (#) | Maximum (#) | ||||||||||
| James C. Mastandrea | ACA | 375,000 | 750,000 | 1,500,000 | ||||||||||||||
| 6/30/2019 | Time-Based Units | 94,073 | 1,000,000 | |||||||||||||||
| 6/30/2019 | TSR Units | 60,828 | 121,655 | 243,310 | 1,000,000 | |||||||||||||
| David K. Holeman | ACA | 187,500 | 375,000 | 750,000 | ||||||||||||||
| 6/30/2019 | Time-Based Units | 44,685 | 475,000 | |||||||||||||||
| 6/30/2019 | TSR Units | 28,893 | 57,786 | 115,572 | 475,000 | |||||||||||||
| John J. Dee | ACA | 62,500 | 125,000 | 250,000 | ||||||||||||||
| 6/30/2019 | Time-Based Units | 21,637 | 230,000 | |||||||||||||||
| 6/30/2019 | TSR Units | 13,991 | 27,981 | 55,962 | 230,000 | |||||||||||||
| Bradford D. Johnson | ACA | 120,000 | 240,000 | 480,000 | ||||||||||||||
| 6/30/2019 | Time-Based Units | 21,637 | 230,000 | |||||||||||||||
| 6/30/2019 | TSR Units | 13,991 | 27,981 | 55,962 | 230,000 | |||||||||||||
| Christine J. Mastandrea | ACA | 120,000 | 240,000 | 480,000 | ||||||||||||||
| 6/30/2019 | Time-Based Units | 21,637 | 230,000 | |||||||||||||||
| 6/30/2019 | TSR Units | 13,991 | 27,981 | 55,962 | 230,000 | |||||||||||||
Estimated Future Payouts Under Non-equity Incentive Plan Awards (1) | Estimated Future Payouts Under Equity Incentive Plan Awards (2) | All Other Stock Awards: Number of Shares or Units (3) (#) | Grant Date Fair Value of Stock Awards (4) ($) | |||||||||||||||||||||||||||||
| Name | Grant Date | Description | Threshold ($) | Target ($) | Maximum ($) | Threshold (#) | Target (#) | Maximum (#) | ||||||||||||||||||||||||
| James C. Mastandrea | AIP | 375,000 | 750,000 | 1,500,000 | ||||||||||||||||||||||||||||
| 7/31/2020 | Time-Based Units | 150,000 | 874,500 | |||||||||||||||||||||||||||||
| 7/31/2020 | TSR Units | 75,000 | 150,000 | 300,000 | 832,500 | |||||||||||||||||||||||||||
| David K. Holeman | AIP | 187,500 | 375,000 | 750,000 | ||||||||||||||||||||||||||||
| 7/31/2020 | Time-Based Units | 75,000 | 437,250 | |||||||||||||||||||||||||||||
| 7/31/2020 | TSR Units | 37,500 | 75,000 | 150,000 | 416,250 | |||||||||||||||||||||||||||
| John J. Dee | AIP | 62,500 | 125,000 | 250,000 | ||||||||||||||||||||||||||||
| 7/31/2020 | Time-Based Units | 37,500 | 218,625 | |||||||||||||||||||||||||||||
| 7/31/2020 | TSR Units | 18,750 | 37,500 | 75,000 | 208,125 | |||||||||||||||||||||||||||
| Bradford D. Johnson | AIP | 120,000 | 240,000 | 480,000 | ||||||||||||||||||||||||||||
| 7/31/2020 | Time-Based Units | 37,500 | 218,625 | |||||||||||||||||||||||||||||
| 7/31/2020 | TSR Units | 18,750 | 37,500 | 75,000 | 208,125 | |||||||||||||||||||||||||||
| Christine J. Mastandrea | AIP | 120,000 | 240,000 | 480,000 | ||||||||||||||||||||||||||||
| 7/31/2020 | Time-Based Units | 37,500 | 218,625 | |||||||||||||||||||||||||||||
| 7/31/2020 | TSR Units | 18,750 | 37,500 | 75,000 | 208,125 | |||||||||||||||||||||||||||
(1) Non-equity incentive plan awards are short-term incentives that may be earned under the annual cash bonus incentive plan. None ofAIP. The NEOs achieved the NEOs earned annual cash incentives in 2019.2020 at the maximum level. Historically, the Compensation Committee had refrained from exercising discretion to modify cash incentives payable pursuant to the AIP. However, despite the fact that the 2020 performance targets were established at the height of the COVID-19 pandemic and that the Company and the executive officers had performed at an exceptional level in 2020, in light of the impact of the pandemic, the Compensation Committee and the Board exercised their discretion to reduce the cash incentives payable to each NEO to Target level rather than 200% of Target.
(2) Represents restricted common share units corresponding to a three-year performance period, FY 20192020 - FY 2021.2022. The NEOs may earn 50% of the targetTarget award upon attainment of the thresholdThreshold performance and up to 200% of the targetTarget award upon attainment of maximumMaximum performance. Performance outcomes will be determined following the conclusion of the performance period. No dividend equivalents will be applied to the actual number of shares earned.
(3) Represents time-based restricted common share unit awardsunits granted under the 2018 Plan in 20182020 that could be earned based on continued employment over a three-year period and vest in equal installments on June 30, 2020,July 31, 2021, 2022 and 2022.2023.
(4) Amounts represent the grant date fair value of share awards measured in accordance with ASC Topic 718, utilizing the assumptions discussed in Note 15 to our audited financial statements for the year ended December 31, 20192020 as included in our 2020 Annual Report.
The material terms of the Messrs. Mastandrea’s and Holeman’s employment agreements are described below in the section entitled “Potential Payments Upon Termination or Change in Control.” For a discussion of the material terms of the annual incentive and stock awards reflected in the Summary Compensation and Grants of Plan Based Awards tables, as well as a description of the amount of salary and annual incentive opportunities in proportion to total compensation, see the discussion above in the section entitled “Compensation Discussion and Analysis.”
51
Outstanding Equity Awards at Fiscal Year End 20192020
The following table sets forth certain information with respect to the market value of all unvested share and unit awards held by each NEO as of December 31, 2019.2020.
| Name | Grant Date | Share Awards | Name | Grant Date | Share Awards | |||||||||||||||||||||
Shares or Units of Stock that Have Not Vested (1) | Equity Incentive Plan Awards: Unearned Shares or Units that Have Not Vested (2) | Shares or Units of Stock that Have Not Vested (1) | Equity Incentive Plan Awards: Unearned Shares or Units that Have Not Vested (2) | |||||||||||||||||||||||
| Number (#) | Market Value ($) (3) | Number (#) | Market Value ($) (3) | Number (#) | Market Value ($) (3) | Number (#) | Market Value ($) (3) | |||||||||||||||||||
| James C. Mastandrea | 6/30/2019 | 94,073 | 1,281,274 | 121,655 | 1,656,941 | James C. Mastandrea | 7/31/2020 | 150,000 | 1,195,500 | 150,000 | 1,195,500 | |||||||||||||||
| 12/1/2018 | 134,318 | 1,829,411 | 6/30/2019 | 62,715 | 499,839 | 121,655 | 969,590 | |||||||||||||||||||
| 3/16/2018 | 76,277 | 1,038,893 | 3/16/2018 | 38,138 | 303,960 | |||||||||||||||||||||
| 9/30/2017 | 200,000 | 2,724,000 | 9/30/2017 | 200,000 | 1,594,000 | |||||||||||||||||||||
| David K. Holeman | 6/30/2019 | 44,685 | 608,610 | 57,786 | 787,045 | David K. Holeman | 7/31/2020 | 75,000 | 597,750 | 75,000 | 597,750 | |||||||||||||||
| 12/1/2018 | 63,802 | 868,983 | 6/30/2019 | 29,790 | 237,426 | 57,786 | 460,554 | |||||||||||||||||||
| 3/16/2018 | 36,232 | 493,480 | 3/16/2018 | 18,116 | 144,385 | |||||||||||||||||||||
| 9/30/2017 | 150,000 | 2,043,000 | 9/30/2017 | 150,000 | 1,195,500 | |||||||||||||||||||||
| John J. Dee | 6/30/2019 | 21,637 | 294,696 | 27,981 | 381,101 | John J. Dee | 7/31/2020 | 37,500 | 298,875 | 37,500 | 298,875 | |||||||||||||||
| 12/01/18 | 30,894 | 420,776 | 6/30/2019 | 14,424 | 114,959 | 27,981 | 223,009 | |||||||||||||||||||
| 3/16/2018 | 16,209 | 220,767 | 3/16/2018 | 8,104 | 64,589 | |||||||||||||||||||||
| 9/30/2017 | 75,000 | 1,021,500 | 9/30/2017 | 75,000 | 597,750 | |||||||||||||||||||||
| Bradford D. Johnson | 6/30/2019 | 21,637 | 294,696 | 27,981 | 381,101 | Bradford D. Johnson | 7/31/2020 | 37,500 | 298,875 | 37,500 | 298,875 | |||||||||||||||
| 12/01/18 | 30,894 | 420,776 | 6/30/2019 | 14,424 | 114,959 | 27,981 | 223,009 | |||||||||||||||||||
| 3/16/2018 | 17,544 | 238,949 | 3/16/2018 | 8,772 | 69,913 | |||||||||||||||||||||
| 9/30/2017 | 100,000 | 1,362,000 | 9/30/2017 | 100,000 | 797,000 | |||||||||||||||||||||
| Christine J. Mastandrea | 6/30/2019 | 21,637 | 294,696 | 27,981 | 381,101 | Christine J. Mastandrea | 7/31/2020 | 37,500 | 298,875 | 37,500 | 298,875 | |||||||||||||||
| 12/01/18 | 30,894 | 420,776 | 6/30/2019 | 14,424 | 114,959 | 27,981 | 223,009 | |||||||||||||||||||
| 3/16/2018 | 17,544 | 238,949 | 3/16/2018 | 8,772 | 69,913 | |||||||||||||||||||||
| 9/30/2017 | 100,000 | 1,362,000 | 9/30/2017 | 100,000 | 797,000 | |||||||||||||||||||||
(1) Represent time-based restricted common share unit awards that vest as follows:
•Grant Date: 7/31/2020 - vest in equal installments on July 31, 2021, 2022 and 2023
•Grant Date: 6/30/2019 - vest in equal installments on June 30, 2020, 2021 and 2022
•Grant Date: 3/16/2018 - vest in equal installments on March 16, 2020 and 2021
(2) The following table provides the vesting schedules of unearned performance-based restricted common share unit
grants outstanding as of December 31, 2019:2020:
| Grant Date | Outstanding Vesting Dates | ||||
| 7/31/2020 | Performance period ending December 31, 2022. The number of restricted common share units reported is based on achievement of target performance. Cumulative performance to date, as of the last completed fiscal year, is below the threshold. | ||||
| 6/30/2019 | Performance period ending December 31, 2021. The number of restricted common share units reported is based on achievement of target performance. Cumulative performance to date, as of the last completed fiscal year, | ||||
| 9/30/2017 | Represents restricted common share units | ||||
(3) Market values are based on the December 31, 2019 closing price of $13.62our common shares of $7.97 per share.share on December 31, 2020.
52
Stock Awards Vested in 20192020
The following table sets forth information with respect to shares and common share units vested during the year ended December 31, 2019.2020.
| Name | Stock Awards (1) | |||||||
Number of Shares Acquired on Vesting (#) (1) | Value Realized on Vesting ($) (2) | |||||||
| James C. Mastandrea | 103,077 | 802,243 | ||||||
| David K. Holeman | 48,962 | 381,069 | ||||||
| John J. Dee | 23,042 | 179,163 | ||||||
| Bradford D. Johnson | 23,709 | 184,526 | ||||||
| Christine J. Mastandrea | 23,709 | 184,526 | ||||||
(1)Represents shares vested on March 16, 2020, June 30, 2020 and December 31, 2020.
(2)Based on the closing price of our common shares of $8.04, $7.27 and $7.97 on March 16, 2020, June 30, 2020 and December 31, 2020, respectively.
53
| Name | Stock Awards (1) | |||
Number of Shares Acquired on Vesting (#) (1) | Value Realized on Vesting ($) (2) | |||
| James C. Mastandrea | 246,217 | 3,216,643 | ||
| David K. Holeman | 115,880 | 1,513,581 | ||
| John J. Dee | 51,092 | 668,126 | ||
| Bradford D. Johnson | 58,357 | 759,896 | ||
| Christine J. Mastandrea | 59,091 | 768,718 | ||
Potential Payments Upon Termination or Change in Control
The following tables summarize the compensation that would have been payable to Messrs. Mastandrea and Holeman if their employment had terminated on December 31, 20192020 without “cause” or for “good reason” (each, as defined in the Employment Agreements), and for each other NEO if such NEO’s employment had terminated on December 31, 20192020 without “cause” or for “good reason” (each, as defined in the Change in Control Agreements) within two years following a Change in Control. The tables also summarize the compensation that would have been payable to each NEO if his or her employment had terminated due to death or disability, or, upon change in control without termination. Due to the number of factors that affect the amount of any benefits provided upon the events discussed below, actual amounts paid or distributed may be different. The below disclosure does not include any amounts for equity awards or other compensation changes made subsequent to December 31, 2019.2020.
Involuntary Termination Without Cause or Termination with Good Reason
| Name | Salary (1) | AIP (2) | Continuation of Benefits (3) | Value of Unvested Restricted Stock Unit Awards (4) | Total | ||||||||||||
| ($) | ($) | ($) | ($) | ($) | |||||||||||||
| James C. Mastandrea | 1,794,000 | 5,235,000 | 277,089 | 5,758,389 | 13,064,478 | ||||||||||||
| David K. Holeman | 1,121,250 | 2,617,500 | 130,490 | 3,233,365 | 7,102,605 | ||||||||||||
| John J. Dee | __ | 125,000 | __ | __ | 125,000 | ||||||||||||
| Bradford D. Johnson | __ | 240,000 | __ | __ | 240,000 | ||||||||||||
| Christine J. Mastandrea | __ | 240,000 | __ | __ | 240,000 | ||||||||||||
| Name | Salary (1) | Bonus | Continuation of Benefits (2) | Value of Unvested Restricted Stock Unit Awards (3) | Total | ||||
| ($) | ($) | ($) | ($) | ($) | |||||
| James C. Mastandrea | 1,794,000 | __ | 251,100 | 7,615,814 | 9,660,914 | ||||
| David K. Holeman | 1,121,250 | __ | 122,356 | 4,366,626 | 5,610,232 | ||||
Involuntary Termination Without Cause or Termination with Good Reason Following a Change in Control
| Name | Salary (1) | Bonus | Continuation of Benefits (2) | Value of Unvested Restricted Stock Unit Awards (3) | Total | Name | Salary (1) | AIP (2) | Continuation of Benefits (3) | Value of Unvested Restricted Stock Unit Awards (4) | Total | ($) | ||||||||||||||
| John J. Dee | 375,000 | __ | 30,194 | 2,128,452 | 2,533,646 | John J. Dee | 375,000 | 500,000 | 27,794 | 1,598,057 | 2,500,851 | |||||||||||||||
| Bradford D. Johnson | 450,000 | __ | 9,637 | 2,487,135 | 2,946,772 | Bradford D. Johnson | 450,000 | 960,000 | 10,002 | 1,802,631 | 3,222,633 | |||||||||||||||
| Christine J. Mastandrea | 450,000 | __ | 14,887 | 2,487,135 | 2,952,022 | Christine J. Mastandrea | 450,000 | 960,000 | 15,169 | 1,802,631 | 3,227,800 | |||||||||||||||
(1) Amount equal to 2.99 times annual salary for Messrs. Mastandrea and Holeman, and 1.5 times annual salary for Messrs. Dee and Johnson and Ms. Mastandrea, in each case as of December 31, 2019.2020.
(2)Amount equal to 2.99 times the 2020 annual incentive award at the 200% achievement level for Messrs. Mastandrea and Holeman, for Involuntary Termination Without Cause or Termination with Good Reason, and 1.5 times the 2020 annual incentive award at the 200% achievement level for Messrs. Dee and Johnson and Ms. Mastandrea, for Involuntary Termination Without Cause or Termination with Good Reason Following a Change in Control, in each case as of December 31, 2020. Also includes retention awards which are payable on December 31, 2024 subject to continued employment. In the event of an Involuntary Termination Without Cause or Termination with Good Reason prior to December 31, 2024, they are fully payable within 60 days of change in control.
(3) Benefits amounts include the cost of (a) health and welfare benefits to the same extent made available to employees generally, including family health insurance, travel accident insurance, life and accidental death insurance, and long term disability insurance, (b) directors and officers liability insurance, (c) full participation in any 401(k), profit sharing, pension or other retirement benefit plan (“Pension Plan”) during employee'semployee’s employment, and (d) such other benefits that the Board may from time to time authorize for a period of three years for Messrs. Mastandrea and Holeman and one year for Messrs. Dee and Johnson and Ms. Mastandrea.
54
Change in Control without Termination
| Name | Salary | Bonus | Continuation of Benefits | Value of Unvested Restricted Stock Unit Awards (1) | Total | Name | Salary | AIP (1) | Continuation of Benefits | Value of Unvested Restricted Stock Unit Awards (2) | Total | ($) | ||||||||||||
| James C. Mastandrea | __ | 7,615,814 | 7,615,814 | James C. Mastandrea | __ | 750,000 | __ | 5,758,389 | 6,508,389 | |||||||||||||||
| David K. Holeman | __ | 4,366,626 | 4,366,626 | David K. Holeman | __ | 375,000 | __ | 3,233,365 | 3,608,365 | |||||||||||||||
| John J. Dee | __ | 2,128,452 | 2,128,452 | John J. Dee | __ | 125,000 | __ | 1,598,057 | 1,723,057 | |||||||||||||||
| Bradford D. Johnson | __ | 2,487,135 | 2,487,135 | Bradford D. Johnson | __ | 240,000 | __ | 1,802,631 | 2,042,631 | |||||||||||||||
| Christine J. Mastandrea | __ | 2,487,135 | 2,487,135 | Christine J. Mastandrea | __ | 240,000 | __ | 1,802,631 | 2,042,631 | |||||||||||||||
(1) The value of the restricted shares and restricted common share units is based on the closing price of our common sharesRepresents retention awards which are payable on December 31, 2019, or $13.62 per share, assuming full release2024 subject to continued employment. In the event of all restrictions, including all performance conditions. The amount is based on achievementa change in control prior to December 31, 2024, they are fully payable within 60 days of target performance.
| Name | Salary (1) | Bonus | Continuation of Benefits (2) | Value of Unvested Restricted Stock Unit Awards (3) | Total (4) | ||||
| ($) | ($) | ($) | ($) | ($) | |||||
| James C. Mastandrea | 1,794,000 | __ | 49,574 | 7,615,814 | 9,459,388 | ||||
| David K. Holeman | 1,121,250 | __ | 55,703 | 4,366,626 | 5,543,579 | ||||
| John J. Dee | __ | __ | __ | 2,128,452 | 2,128,452 | ||||
| Bradford D. Johnson | __ | __ | __ | 2,487,135 | 2,487,135 | ||||
| Christine J. Mastandrea | __ | __ | __ | 2,487,135 | 2,487,135 | ||||
Death or $13.62Disability
| Name | Salary (1) | AIP (2) | Continuation of Benefits (3) | Value of Unvested Restricted Stock Unit Awards (4) | Total (5) | ||||||||||||
| ($) | ($) | ($) | ($) | ($) | |||||||||||||
| James C. Mastandrea | 1,800,000 | 5,250,000 | 50,265 | 5,758,389 | 12,858,654 | ||||||||||||
| David K. Holeman | 1,125,000 | 2,625,000 | 56,414 | 3,233,365 | 7,039,779 | ||||||||||||
| John J. Dee | __ | 125,000 | __ | 1,598,057 | 1,723,057 | ||||||||||||
| Bradford D. Johnson | __ | 240,000 | __ | 1,802,631 | 2,042,631 | ||||||||||||
| Christine J. Mastandrea | __ | 240,000 | __ | 1,802,631 | 2,042,631 | ||||||||||||
(1) Reflects three years of continued base salary and bonus. Salary continuation would not be provided upon termination due to the executive’s death.
(2) Reflects three years of the 2020 annual incentive award at the 200% achievement level for Messrs. Mastandrea and Mr. Holeman, and for all NEOs, retention awards which are payable on December 31, 2024 subject to continued employment. In the event of death or disability prior to December 31, 2024, they are fully payable within 60 days of death or disability.
(3) Reflects three years of continued health and welfare benefits. The benefits would not be provided following termination due to the executive’s death.
(4) The value of the restricted shares and restricted common share units is based on the closing price of our common shares on December 31, 2020, of $7.97 per share, assuming full release of all restrictions, including all performance conditions. The amount is based on achievement of target performance.
(5) The actual amounts provided would be net of any disability benefits paid to the executive by the Company, or any insurance funded by the Company. Amounts shown have not been reduced for such disability benefits.
56
Employment Agreements; Payments Upon Change in Control
Employment Agreements.
On August 29, 2014, the Company entered into employment agreements (the “Employment Agreements”) with Messrs. Mastandrea and Holeman. The Employment Agreements each have an initial term of three (3) years, subject to automatic renewal for successive one (1) year periods unless either party provides notice of non-renewal at least ninety (90)90 days prior to the next automatic expiration date. The contracts provideoriginally provided for base salaries of no less than $400,000 and $250,000, respectively, per year to Messrs. Mastandrea and Holeman, and each of them is entitled to an annual bonus upon the satisfaction of performance criteria established by the Compensation Committee.
On February 10, 2021, the Company entered into an amendment to Employment Agreement with each of Messrs. Mastandrea and Holeman. The amendments increased Messrs. Mastandrea and Holeman’s base salaries to $600,000 and $375,0000, respectively and provided each of Messrs. Mastandrea and Holeman a single, lump-sum retention payment opportunity in the amount of $750,000 and $375,000, respectively (the “Retention Payment”), payable on March 15, 2025 (the “Retention Date”), subject to the executive’s continued employment with the Company through December 31, 2024. In the event of a change in control or a termination of the executive’s employment by the Company without cause, by the executive for good reason, or due to the executive’s death or disability, in each case, prior to December 31, 2024 (each a “Retention Trigger”), each of Messrs. Mastandrea and Holeman will be entitled to receive his applicable Retention Payment within 60 days of the Retention Trigger. In the event that the executive’s employment is terminated (other than due to a Retention Trigger) prior to the Retention Date, the Retention Payment will be forfeited.
In addition, each officer will be entitled to three years of continued benefits, as have been provided to the officers since 2006, including insurance (family health, life, accidental death, disability and director and officer liability) coverage, company automobiles, annual physicals and participation in the Company’s 401(k) and other pension benefit plans available to all employees.
Upon any termination (either before or after a change in control, as defined in the 2008 Plan) of an officer’s employment by the Company without cause or by the officer for good reason, as defined in the Employment Agreements and summarized below, the officer’s restricted common shares and restricted share units will immediately vest and the officer will be entitled to a severance payment equal to 2.99 times the sum of his then-current salary and last year’s bonus, as well as continuation of benefits for three (3) years. Pursuant to the amendment to Employment Agreements with each of Messrs. Mastandrea and Holeman, if such termination occurs during the 2021 calendar year, the reductions made in 2020 to each of Messrs. Mastandrea’s and Holeman’s 2020 annual incentives ($750,000 and $375,000, respectively) would be disregarded when calculating severance entitlements. As a condition to receiving any severance payment, the officer is required to execute and deliver a blanket release of the Company from any and all current and prior claims. In addition, for a period of one (1) year from and after termination of employment, except in the capacity of a less than 1% passive investor in a public company, each officer is restricted from having any interest in or performing any services in respect of any property that meets the Company’s publicly-stated definition of a Community Centered Property (as defined in the Employment Agreements) within a five (5) mile radius of any property then-owned by the Company. Mr. Holeman will be deemed to have been terminated by the Company without cause if Mr. Mastandrea ceases to serve as the Chairman of the Board and/or President and Chief Executive Officer of the Company on account of termination of Mr. Mastandrea’s employment by the Company without cause, Mr. Mastandrea’s termination of his employment for good reason and/or Mr. Mastandrea’s failure to be renominated and/or re-elected as a member of the Board. If either the Company or the officer gives notice to the other of an intention not to extend the term of employment for an additional year, and a termination occurs, that termination will be treated as a termination by the Company or by the officer, as the case may be, with or without cause, and for or not for good reason, as the case may be.
57
For purposes of the Employment Agreements, “good reason” includes the occurrence of any one of the following events:
(i) For Mr. Mastandrea, reduction of his annual base salary below $400,000,$600,000, and for Mr. Holeman, reduction of his annual base salary below $250,000;$375,000;
(ii) The Company fails to continue to provide the compensation as detailed in the Employment Agreement (base salary, bonus eligibility, performance awards pursuant to the 2008 Plan and the 2018 Plan and benefits and expense reimbursements);
(iii) The Company fails in any material respect to provide benefits and expense reimbursements, as detailed in the Employment Agreement, in either case after either officer has given the Company written notice of such failure, and the Company has failed to effect a cure within 60 days after the notice is given;
(iv) Either removal from any of the officer’s offices or responsibilities, or the officer’s duties with the Company are otherwise reduced to such an extent that he no longer has authority commensurate with the Chairman of the Board and Chief Executive Officer for Mr. Mastandrea and Chief Financial Officer for Mr. Holeman, in each case of a publicly-traded REIT;
(v) A change in the officer’s principal place of employment for the Company outside of the Houston and Phoenix metropolitan areas for Mr. Mastandrea, and the Houston metropolitan area for Mr. Holeman, and as a result, the officer is required to relocate; and
(vi) After a “shift in ownership”, as defined in the Employment Agreements and summarized below, the Board fundamentally changes its strategic plan in a manner opposed by the officer, in which case such officer may not terminate his employment unless he first gives the Board written notice specifying the change or changes that he opposes and the steps that the Board must take to rectify the strategic plan, and the Board fails to take those steps within 60 days after the notice is given.
For purposes of the Employment Agreements, a “shift in ownership” is deemed to occur, generally, when any person or entity, including a “group” as defined in Section 13(d)(3) of the Exchange Act, other than us or one of our wholly-owned subsidiaries or any employee benefit plan of us or any of our subsidiaries, becomes the beneficial owner of 20% or more of the combined voting power of our outstanding securities that may be cast for the election of our trustees; provided that no shift in ownership shall be deemed to have occurred if, prior to such acquisition, the acquisition is supported by the respective officer and approved by the Board.
Upon termination of the executive’s employment by the Company due to the executive’s disability, the Company would continue to provide health and welfare benefits, including contribution to any pension plan, that were being provided to the executive immediately before the executive became disabled as if the executive had continued to be actively employed, until the earliest of (i) the first date on which he is no longer disabled, (ii) the date of his death, and (iii) the third anniversary of the date on which the executive became disabled.
Change in Control Agreements.
On August 29, 2014, the Company entered into Change in Control Agreements (the “Change in Control Agreements”) with Messrs. Dee and Johnson and Ms. Mastandrea. Each Change in Control Agreement provides that if the officer’s employment is terminated by the Company (or any successor) without “cause” (as defined in the Change in Control Agreements) or by the officer for “good reason” (as defined in the Change in Control Agreements and summarized below) upon or within two (2) years after a “change in control” of the Company (as defined in the 2008 Plan), the officer will receive a severance payment equal to 1.5 times the sum of the officer’s then current annual base salary plus the amount of any bonus paid for the prior year, as well as continuation of benefits for one (1) year. In addition, the Change in Control Agreements provide that all unvested restricted common shares and restricted share units would vest to the extent not theretofore vested. Each officer will be deemed to have been terminated by the Company without cause if Mr. Mastandrea ceases to serve as the Chairman of the Board and/or President and Chief Executive Officer of the Company on account of termination of Mr. Mastandrea’s employment by the Company without cause, Mr. Mastandrea’s termination of his employment for good reason and/or Mr. Mastandrea’s failure to be renominated and/or re-elected as a member of the Board.
58
On February 10, 2021, the Company entered into an amendment to Change in Control Agreements with each of Ms. Mastandrea and Messrs. Dee and Johnson. The amendments to Change in Control Agreements provided each of Ms. Mastandrea and Messrs. Johnson and Dee a single, lump-sum payment retention payment opportunity in the amount of $240,000, $240,000 and $125,000, respectively (the “Retention Payment”), payable on March 15, 2025 (the “Retention Date”), subject to the executive’s continued employment with the Company through December 31, 2024. In the event of a change in control or a termination of executive’s employment by the Company without cause, by the executive for good reason, or due to the executive’s death or disability, in each case, prior to December 31, 2024 (each a “Retention Trigger”), each of Ms. Mastandrea and Messrs. Dee and Johnson will be entitled to receive his or her applicable Retention Payment within 60 days of the Retention Trigger. In the event that the executive’s employment is terminated (other than due to a Retention Trigger) prior to the Retention Date, the Retention Payment will be forfeited. The amendments also provide that if a termination occurs during the 2021 calendar year, the reductions made in 2020 to each of Ms. Mastandrea’s and Messrs. Johnson’s and Dee’s 2020 annual incentives ($240,000 and $240,000, and $125,000 respectively) would be disregarded when calculating their severance entitlements.
The Change in Control Agreements will remain effective until the officer’s employment is terminated for any reason; provided that the officer will receive the benefits specified above upon termination of employment by the Company without cause or the officer for good reason after a change in control. As a condition to receiving any severance payment, the officer is required to execute and deliver a blanket release of the Company from any and all current and prior claims. In addition, for a period of one (1) year from and after termination of employment, except in the capacity of a less than 1% passive investor in a public company, each officer is restricted from having any interest in or performing any services in respect of any property that meets the Company’s publicly-stated definition of a Community Centered Property (as defined in the Change in Control Agreements) within a five (5) mile radius of any property then-owned by the Company.
For purposes of the Change in Control Agreements, “good reason” generally includes the occurrence of any one of the following events:
(i) Reduction of the officer’s annual base salary below the amount in effect at the time of a change in control;
(ii) Bonus payment for the annual period first ending after the change in control is less than the officer’s bonus for the calendar year ending immediately prior to the change in control;
(iii) Benefits are materially reduced from those benefits in effect at the time of the change in control;
(iv) The officer is removed from any of his or her offices or responsibilities or his or her duties with the Company are otherwise reduced to such an extent that he or she no longer has the same authority commensurate with his or her duties to the Company at the time of the change in control; and
(v) The officer’s principal place of employment for the Company is relocated outside of the Houston metropolitan area and, as a result, he or she is required to relocate.
59
Treatment of Equity Upon Change in Control.
Pursuant to our 2008 Plan and our 2018 Plan, in the event of the participant’s death or disability any unvested restricted common shares or units will immediately vest. In the event of a Change in Control of the Company, as defined below, (i) all restricted shares, restricted share units, and options theretofore granted and not yet vested, will become fully vested (and restricted share units shall be automatically replaced with fully vested shares), exercisable and issued as of a time immediately before the Change in Control, and (ii) all restrictions and conditions applicable to restricted shares and other share awards will be deemed to have been satisfied as of the date of the Change in Control.
For purposes of our 2008 Plan and our 2018 Plan, “Change in Control” means, unless otherwise defined in the applicable award agreement, any of the following events:
•any person or entity, including a “group” as defined in Section 13(d)(3) of the Exchange Act, other than us or one of our wholly-owned subsidiaries or any employee benefit plan of us or any of our subsidiaries, becomes the beneficial owner of 35% or more of the combined voting power of our outstanding securities that may be cast for the election of our trustees;
•as the result of, or in connection with, any cash tender or exchange offer, merger or other business combination or contested election, less than a majority of the voting power of our outstanding securities or any successor company or entity entitled to vote generally in the election of our trustees or other corporation or entity after such transaction is held in the aggregate by our security holders entitled to vote generally in the election of our trustees immediately prior to such transaction;
•during any period of two consecutive years, individuals who at the beginning of that period constitute our Board cease for any reason to constitute at least a majority thereof, unless the election, or the nomination for election by our shareholders, of each of our trustees first elected during that period was approved by a vote of at least two-thirds of our trustees then still in office who were (a) our trustees at the beginning of that period, and (b) not initially (1) appointed or elected to office as a result of either an actual or threatened election and/or proxy contest by or on behalf of a person other than our Board, or (2) designated by a person who has entered into an agreement with us to effect a transaction described in the first two bullet points above or the following two bullet points below;
•our complete liquidation or dissolution;
•the sale or other disposition of all or substantially all of our assets to any person; or
•with respect to award agreements for Messrs. Mastandrea, Dee and Holeman only, a termination of our Chief Executive Officer without cause, excluding non-appealable determinations by a court of law for fraud, gross negligence, or willful neglect, which would be considered termination for cause.
60
PROPOSAL NO. 2 - ADVISORY VOTE ON EXECUTIVE COMPENSATION
Dodd-Frank added Section 14A to the Exchange Act, which requires that we provide our shareholders with the opportunity to vote to approve, on a non-binding, advisory basis, the compensation of our NEOs as disclosed in this proxy statement in accordance with the compensation disclosure rules of the SEC. At the 2017 annual meeting of the Company’s shareholders, the shareholders of the Company voted to approve an advisory resolution on the frequency of non-binding advisory votes to approve the compensation of our NEOs once every year and our Board subsequently determined to hold a non-binding advisory vote to approve the compensation of our NEOs every year until the next advisory vote on the frequency of non-binding advisory votes to approve the compensation of our NEOs, which will occur no later than the 2023 annual meeting of the Company’s shareholders.
As described in detail under the heading “Compensation Discussion and Analysis,” we seek to closely align the interests of our NEOs with the interests of our shareholders. Our compensation programs are designed to reward our NEOs for the achievement of long-term strategic and operational goals and the achievement of increased value for shareholders. The NEOs’ willingness to voluntarily reduce their base salaries to reduce costs and expand their responsibilities to maintain efficient operations with reduced manpower, is a powerful statement of commitment to the long-term success of Whitestone and our shareholders. Our 2008 and 2018 Plans further align the interests of our NEOs with those of our shareholders, as the primary grants to our NEOs pursuant to the 2008 and 2018 Plan provide for performance-based vesting of our shares. We encourage you to carefully review the section of this proxy statement entitled “Compensation Discussion and Analysis” for additional details on our executive compensation program as well as the reasons and processes for how our Compensation Committee determined the structure and amounts of the 20192020 compensation of our NEOs.
We are asking our shareholders to indicate their support for the compensation of our NEOs as set forth in this proxy statement. Accordingly, we are asking our shareholders to vote “FOR” the following resolution at the Annual Meeting.
“RESOLVED, that the shareholders of Whitestone REIT approve, on a non-binding advisory basis, the compensation of Whitestone REIT’s named executive officers, as disclosed pursuant to item 402 of Regulation S-K, including the Compensation Discussion and Analysis, executive compensation tables and narrative discussion, as set forth in this proxy statement.”
The vote on this resolution is not intended to address any specific element of compensation; rather, the vote relates to the compensation of our NEOs, as described in this proxy statementProxy Statement in accordance with the compensation disclosure rules of the SEC. The vote is advisory, which means that the vote is not binding on the Company, the Board or the Compensation Committee. Nevertheless, the views expressed by our shareholders, whether through this vote or otherwise, are important to us and, accordingly, the Board and the Compensation Committee intend to consider the results of this vote in making determinations in the future regarding executive compensation arrangements.
To be approved, Proposal No. 2 (advisory vote on executive compensation), must receive the affirmative vote of a majority of all votes cast at the Annual Meeting, whether in person (virtually) or by proxy (which means the votes cast “FOR” the proposal must exceed the votes cast “AGAINST” the proposal). For purposes of the vote on this proposal, abstentions and broker non-votes will not be counted as votes cast and will have no effect on the result of the vote, although they will be considered present for the purpose of determining a quorum.
Our Board unanimously recommends that you vote “FOR” the approval, on a non-binding, advisory basis, of the compensation of our NEOs as disclosed in this Proxy Statement.
61
AUDIT COMMITTEE INFORMATION
Report of the Audit Committee of the Board
The Audit Committee is composed of four independent, non-employee trustees and operates under a written charter adopted by the Board (a copy of which is available at www.whitestonereit.com). The Board has determined that each committee member is independent within the meaning of the applicable NYSE listing standards currently in effect and as required by the Sarbanes-Oxley Act of 2002. Management is responsible for the financial reporting process, including the preparation of the consolidated financial statements in accordance with GAAP, and for the establishment and effectiveness of internal control over financial reporting. The Company's independent registered public accounting firm, Pannell Kerr Forster of Texas, P.C. (“PKF”), is responsible for auditing those financial statements and expressing an opinion as to whether they fairly present our financial condition, results of operations, shareholders' equity and cash flows in conformity with GAAP. The committee’s responsibility is to oversee and review this process. We are not, however, professionally engaged in the practice of accounting or auditing, and do not provide any expert or other special assurances as to such financial statements concerning compliance with the laws, regulations or GAAP or as to the independence of the registered public accounting firm. The committee relies, without independent verification, on the information provided to us and on the representations made by management and PKF. We held sixfour meetings during 2019.2020. The meetings were designed, among other things, to facilitate and encourage communication among the committee, management and PKF. We discussed with PKF the overall scope and plans of their annual audit and quarterly reviews. We met with PKF, with and without management present, to discuss the results of their examinations.
We have reviewed and discussed the audited consolidated financial statements for the fiscal year ended December 31, 20192020 with management and PKF. We also discussed with management and PKF the process used to support certifications by our Chief Executive Officer and Chief Financial Officer that are required by the SEC and the Sarbanes-Oxley Act of 2002 to accompany our periodic filings with the SEC. In addition, we reviewed and discussed with management our compliance as of December 31, 20192020 with Section 404 of the Sarbanes-Oxley Act of 2002.
The Audit Committee has discussed with PKF the matters required to be discussed by the applicable standards of the Public Company Accounting Oversight Board (“PCAOB”) and the Commission. The Audit Committee has received the written disclosures and the letter from PKF required by applicable requirements of the PCAOB regarding PKF's communications with the Audit Committee concerning independence, and has discussed with PKF its independence. When considering the independence of PKF, we considered whether its array of services to Whitestone beyond those rendered in connection with its audit of our consolidated financial statements and reviews of our consolidated financial statements, including our quarterly reports on Form 10-Q, was compatible with maintaining its independence. We also reviewed, among other things, the audit and non-audit services performed by, and the amount of fees paid for these services to, PKF.
Based on the foregoing review and discussions and relying thereon, we have recommended to our Board that the audited financial statements for the fiscal year ended December 31, 20192020 be included in Whitestone’s Annual Report on Form 10-K. The Audit Committee also reappointed, and the Board has approved, PKF as Whitestone's independent registered public accounting firm for the fiscal year ending December 31, 2020.2021.
The undersigned members of the Audit Committee have furnished this report to our Board.
Respectfully submitted,
Audit Committee
Nandita V. Berry
Paul T. Lambert
The foregoing report shall not be deemed incorporated by reference by any general statement incorporating by reference this Proxy Statement into any filing under the Securities Act or under the Exchange Act, except to the extent that we specifically incorporate this information by reference, and shall not otherwise be deemed filed under such acts.
62
Independent Registered Public Accounting Firm Fees and Services
The following table sets forth the fees billed for professional audit services rendered by PKF, our independent registered public accounting firm, for the audit of our annual consolidated financial statements for the two most recent fiscal years ended December 31, 20192020 and 2018,2019, and fees billed for other services rendered by PKF for those periods:
| Types of Services | Total Approximate Fees | |||||||
| 2020 | 2019 | |||||||
Audit Fees (1) | $402,490 | $440,520 | ||||||
| Audit-Related Fees | __ | __ | ||||||
| Tax Fees | __ | __ | ||||||
All Other Fees(2) | 25,000 | 53,752 | ||||||
| Total | $427,490 | $494,272 | ||||||
| Types of Services | Total Approximate Fees | |
| 2019 | 2018 | |
Audit Fees (1) | 440,520 | 360,804 |
| Audit-Related Fees | __ | __ |
| Tax Fees | __ | __ |
All Other Fees(2) | 53,752 | 85,978 |
| Total | 494,272 | 446,782 |
(2)Fees billed for 2020 and 2019 primarily related to responses to comment letters received from the SEC related to our SEC filings, regulatory audit of material disposition and registration statement.
The Audit Committee has considered the audit and non-audit services rendered by PKF and has determined that the providing of these services is compatible with maintaining the independence of PKF.
Pre-Approval Policies and Procedures
The Audit Committee has adopted a policy requiring it to approve all audit and non-audit services to be performed by our independent registered public accounting firm to assure that the provision of the services does not impair the firm’s independence. All services, engagement terms, conditions and fees, as well as changes in the terms, conditions and fees must be pre-approved by the Audit Committee in advance. The Audit Committee will annually review and approve services that may be provided by our independent registered public accounting firm during the next year and will revise the list of approved services from time to time based on subsequent determinations. The authority to approve services may be delegated by the Audit Committee to one or more of its members, but may not be delegated to management. If authority to approve services has been delegated to an Audit Committee member, any approval of services must be reported to the Audit Committee at its next scheduled meeting. All audit and non-audit services rendered by our independent registered public accounting firm during the years ended December 31, 20192020 and 20182019 were pre-approved by the Audit Committee in accordance with its policies.
63
PROPOSAL NO. 3 – RATIFICATION OF THE APPOINTMENT OF THE INDEPENDENT REGISTERED PUBLIC ACCOUNTING FIRM
The Audit Committee has appointed PKF to serve as our independent registered public accounting firm for the fiscal year ending December 31, 2020.2021.
The Board asks shareholders to ratify the appointment of PKF as our independent registered public accounting firm. Shareholder ratification of the appointment of PKF as our independent registered public accounting firm is not required by our bylaws or other governing documents. However, the Board is submitting the appointment of PKF to the shareholders for ratification as a matter of good corporate governance. If the appointment is not ratified, the Audit Committee will consider whether it is appropriate to select another registered public accounting firm. Even if the appointment is ratified, the Audit Committee, in its discretion, may select a different registered public accounting firm at any time during the year if it determines that a change would be in the best interests of Whitestone and our shareholders. Whitestone does not expect a representative from PKF to attend the Annual Meeting and, accordingly, no representative from PKF is expected to make a statement or be available to respond to questions.
For the ratification of the appointment of our independent registered public accounting firm to be approved, Proposal No. 3 must receive the affirmative vote of a majority of all votes cast at the Annual Meeting, whether in person (virtually) or by proxy (which means the number of votes cast “FOR” the proposal must exceed the number of votes cast “AGAINST” the proposal). In determining whether Proposal No. 3 has received the requisite number of affirmative votes, abstentions will have no impact because they will not be counted as votes cast for this purpose, although they will be considered present for the purpose of determining a quorum.
Our Board unanimously recommends that you vote “FOR” the ratification of the Audit Committee’s appointment of Pannell Kerr Forster of Texas, P.C. as our independent registered public accounting firm for the year ending December 31, 2020.
2021.
64
CERTAIN RELATIONSHIPS AND RELATED TRANSACTIONS
Policies and Procedures for Transactions with Related Persons
Under SEC rules, a related person transaction is any transaction or any currently proposed transaction in which the Company was or is to be a participant, the amount involved exceeds $120,000, and in which any related person had or will have a direct or indirect material interest. A “related person” is a director, officer, nominee for director or a more than 5% shareholder since the beginning of our last completed fiscal year, and their immediate family members.
Pillarstone Capital REIT. Mr. James C. Mastandrea, the Chairman and Chief Executive Officer of the Company, also serves as the Chairman and Chief Executive Officer of Pillarstone Capital REIT and beneficially owns approximately 78.6%78.2% of the outstanding equity in Pillarstone Capital REIT (when calculated in accordance with Rule 13d-3(d)(1) under the Exchange Act).
John J. Dee, the Chief Operating Officer and Corporate Secretary of the Company, also serves as the Senior Vice President and Chief Financial Officer of Pillarstone Capital REIT and beneficially owns approximately 26.8%27.0% of the outstanding equity in Pillarstone Capital REIT (when calculated in accordance with Rule 13d-3(d)(1) under the Exchange Act). In addition, Paul T. Lambert, a Trustee of the Company, also serves as a Trustee of Pillarstone Capital REIT.
As of December 31, 2019,2020, we owned approximately 81.4% of the total outstanding Class A units representing limited partnership interests in Pillarstone Capital REIT Operating Partnership LP (“Pillarstone OP”), the operating partnership of Pillarstone Capital REIT. We account for Pillarstone OP under the equity method in our consolidated financial statements.
Pursuant to its charter, the Nominating and Corporate Governance Committee is responsible for reviewing any potential or actual conflicts of interest between our trustees and between Whitestone and other companies on which a trustee of Whitestone may serve.
Under our Declaration of Trust, we may enter into any contract or transaction with our trustees, officers, employees or agents (or any affiliated person), provided that in the case of any contract or transaction in which any of our trustees, officers, employees or agents (or any affiliated person) have a material financial interest, (1) the fact of the interest is disclosed or known to the following: (a) the Board, and the Board shall approve or ratify the contract or transaction by the affirmative vote of a majority of disinterested trustees, even if the disinterested trustees constitute less than a quorum, or (b) the shareholders entitled to vote, and the contract or transaction is authorized, approved or ratified by a majority of the votes cast by the shareholders entitled to vote other than the votes of shares owned of record or beneficially by the interested party; or (2) the contract or transaction is fair and reasonable to us. In addition, the Nominating and Corporate Governance Committee manages risks associated with the independence of the Board and potential conflicts of interest.
According to our Code of Business Conduct and Ethics, our employees and trustees are expected to exhibit and promote the highest standard of honest and ethical conduct, by their adherence to the following policies and procedures: (1) they shall engage in only honest and ethical conduct, including the ethical handling of actual or apparent conflicts of interest between personal and professional relationships; and (2) they shall inform our chief operating officer of any deviations in practice from policies and procedures governing honest and ethical behavior or any material transaction or relationship that comes to their attention that could reasonably be expected to create a conflict of interest. The Audit Committee oversees compliance with our Code of Business Conduct and Ethics. Our Code of Business Conduct and Ethics is available under the “Corporate Governance” page of our website at www.whitestonereit.com.
65
OTHER MATTERS
Documents Incorporated by Reference
This Proxy Statement incorporates documents by reference that are not presented herein or delivered herewith, including our bylaws. These documents are available upon request without charge. Requests should be sent to Whitestone REIT, 2600 South Gessner Road, Suite 500, Houston, Texas 77063, Attention: Investor Relations or by calling (713) 435-2219.
Other Business
The Board knows of no other business to be presented for action at the Annual Meeting. If any matters do come before the meeting on which action can properly be taken, it is intended that the proxies shall vote in accordance with the discretion of the person or persons exercising the authority conferred by the proxy at the meeting. The submission of a proposal does not guarantee its inclusion in our proxy statement or presentation at the Annual Meeting unless certain securities law and other requirements are met.
You are cordially invited to attend the 20202021 Annual Meeting of Shareholders conducted via live audio webcast that can be accessed by visiting www.virtualshareholdermeeting.com/WSR2020.WSR2021. If you plan to attend the Annual Meeting online, you will need the 16-digit control number included in your Notice of Internet Availability of Proxy Materials, on your Proxy Card or on the instructions that accompany your Proxy Materials. The Annual Meeting will begin promptly at 10:00 a.m., Mountain StandardCentral Daylight Time. Online check-in will begin at 9:45 a.m., Mountain StandardCentral Daylight Time, and you should allow ample time for the online check-in procedures.
Whether or not you plan to attend the Annual Meeting, you are requested to vote in accordance with the instructions herein.
By order of the Board of Trustees,
John J. Dee
Chief Operating Officer and Corporate Secretary
April 3, 20202, 2021
Houston, Texas
66
APPENDIX A
RECONCILIATION OF NON-GAAP MEASURES
(in thousands)
| Year Ended | ||||||||||||||||||||
| December 31, | ||||||||||||||||||||
| FFO, FFO CORE and AFFO | 2020 | 2019 | ||||||||||||||||||
| Net income attributable to Whitestone REIT | $ | 6,034 | $ | 23,683 | ||||||||||||||||
| Adjustments to reconcile to FFO: | ||||||||||||||||||||
| Depreciation and amortization of real estate | 28,096 | 26,468 | ||||||||||||||||||
| Depreciation and amortization of real estate assets of real estate partnership (pro rata) | 1,673 | 2,362 | ||||||||||||||||||
| Gain on disposal of assets and properties of continuing operations, net | 364 | (638) | ||||||||||||||||||
| (Gain) loss on sale of assets and properties of discontinued operations, net | — | (594) | ||||||||||||||||||
| Gain on sale or disposal of properties or assets of real estate partnership (pro rata) | 91 | (13,800) | ||||||||||||||||||
| Net income attributable to noncontrolling interests | 117 | 545 | ||||||||||||||||||
| FFO | 36,375 | 38,026 | ||||||||||||||||||
| Adjustments to reconcile to FFO Core: | ||||||||||||||||||||
| Share-based compensation expense | 6,063 | 6,483 | ||||||||||||||||||
| Early debt extinguishment costs of real estate partnership | — | 426 | ||||||||||||||||||
| Gain on loan forgiveness | (1,734) | — | ||||||||||||||||||
| FFO Core | $ | 40,704 | $ | 44,935 | ||||||||||||||||
| Straight line rent | 542 | (1,372) | ||||||||||||||||||
| Market rent amortization | (824) | (724) | ||||||||||||||||||
| Non real estate depreciation and amortization | 207 | 272 | ||||||||||||||||||
| Amortization of loan fees | 1131 | 1,229 | ||||||||||||||||||
| Tenant improvements | (2813) | (4,122) | ||||||||||||||||||
| Maintenance capital | (3815) | (5,048) | ||||||||||||||||||
| Leasing commissions | (1270) | (2,664) | ||||||||||||||||||
| AFFO | $ | 33,862 | $ | 32,506 | ||||||||||||||||
| Three Months Ended | Year Ended | |||||||||||||||
| December 31, | December 31, | |||||||||||||||
| FFO AND FFO CORE | 2019 | 2018 | 2019 | 2018 | ||||||||||||
| Net income attributable to Whitestone REIT | $ | 15,776 | $ | 8,457 | $ | 23,683 | $ | 21,431 | ||||||||
| Adjustments to reconcile to FFO: | ||||||||||||||||
| Depreciation and amortization of real estate | 6,811 | 6,565 | 26,468 | 25,401 | ||||||||||||
| Depreciation and amortization of real estate assets of real estate partnership (pro rata) | 441 | 776 | 2,362 | 2,903 | ||||||||||||
| Gain on disposal of assets and properties of continuing operations, net | (753 | ) | (174 | ) | (638 | ) | (4,547 | ) | ||||||||
| (Gain) loss on sale of assets and properties of discontinued operations, net | 107 | — | (594 | ) | — | |||||||||||
| Gain on sale or disposal of properties or assets of real estate partnership (pro rata) | (13,820 | ) | (6,350 | ) | (13,800 | ) | (6,340 | ) | ||||||||
| Net income attributable to noncontrolling interests | 360 | 217 | 545 | 550 | ||||||||||||
| FFO | 8,922 | 9,491 | 38,026 | 39,398 | ||||||||||||
| Adjustments to reconcile to FFO Core: | ||||||||||||||||
| Share-based compensation expense | 1,713 | 1,864 | 6,483 | 6,758 | ||||||||||||
| Proxy contest professional fees | — | — | — | 2,534 | ||||||||||||
| Early debt extinguishment costs of real estate partnership | 426 | 88 | 426 | 88 | ||||||||||||
| FFO Core | $ | 11,061 | $ | 11,443 | $ | 44,935 | $ | 48,778 | ||||||||
FFO: Funds From Operations: Management believes that FFO is a useful measure of the Company's operating performance. The Company computes FFO as defined by NAREIT, which states that FFO should represent net income available to common shareholders (computed(loss) (calculated in accordance with GAAP), excluding depreciation and amortization related to real estate, gains or losses from salesthe sale of operating assets or assets of unconsolidatedcertain real estate partnership,assets, gains and losses from change in control, and impairment charges and extraordinary items, plus depreciation and amortizationwrite-downs of operating properties, including the Company's share of unconsolidatedcertain real estate joint venturesassets and partnerships.investments in entities when the impairment is directly attributable to decreases in the value of depreciable real estate held by the entity. FFO does not represent cash flows from operating activities determined in accordance with GAAP and should not be considered an alternative to net income as an indication of the Company's performance or to cash flow from operations as a measure of liquidity or ability to make distributions and service debt.
Management considers FFO a useful additional measure of performance for an equity REIT because it facilitates an understanding of the operating performance of its properties without giving effect to real estate depreciation and amortization, which assumes that the value of real estate assets diminishes predictably over time. Since real estate values have historically risen or fallen with market conditions, management believes that FFO provides a more meaningful and accurate indication of the Company's performance and useful information for the investment community to compare Whitestone to other REITs since FFO is generally recognized as the industry standard for reporting the operations of REITs.
Other REITs may use different methodologies for calculating FFO, and accordingly, the Company's FFO may not be comparable to other REITs. The Company presents FFO per diluted share calculations that are based on the outstanding dilutive common shares plus the outstanding OP units for the periods presented.
67
FFO Core: Funds From Operations Core: Management believes that the computation of FFO in accordance with NAREIT's definition includes certain non-cash and non-comparable items that affect the Company's period-over-period performance. These items include, but are not limited to, legal settlements, proxy contest fees, debt extension costs, non-cash share-based compensation expense and rent support agreement payments received from sellers on acquired assets. In addition, the Company believes that FFO Core is a useful supplemental measure for the investing community to use in comparing the Company to other REITs as many REITs provide some form of adjusted or modified FFO. However, other REITs may use different adjustments, and the Company's FFO Core may not be comparable to the adjusted or modified FFO of other REITs.
| Three Months Ended | Year Ended | |||||||||||||||
| December 31, | December 31, | |||||||||||||||
| EARNINGS BEFORE INTEREST, TAX, DEPRECIATION AND AMORTIZATION | 2019 | 2018 | 2019 | 2018 | ||||||||||||
| Net income attributable to Whitestone REIT | $ | 15,776 | $ | 8,457 | $ | 23,683 | $ | 21,431 | ||||||||
| Depreciation and amortization | 6,875 | 6,635 | 26,740 | 25,679 | ||||||||||||
| Equity in earnings of real estate partnership | (13,596 | ) | (6,669 | ) | (15,076 | ) | (8,431 | ) | ||||||||
| Interest expense | 6,547 | 6,472 | 26,285 | 25,177 | ||||||||||||
| Provision for income taxes | 76 | 87 | 400 | 347 | ||||||||||||
| Gain on sale of assets and properties of continuing operations, net | (816 | ) | — | (853 | ) | (4,629 | ) | |||||||||
| Loss (gain) on sale of assets and properties of discontinued operations, net | 107 | — | (594 | ) | — | |||||||||||
| Management fee, net of related expenses | 22 | (59 | ) | (42 | ) | (208 | ) | |||||||||
| Loss (gain) on disposal of assets and properties of continuing operations, net | 63 | (175 | ) | 215 | 82 | |||||||||||
| EBITDA adjustments for real estate partnership | 1,039 | 1,771 | 5,939 | 7,463 | ||||||||||||
| Net income attributable to noncontrolling interests | 360 | 217 | 545 | 550 | ||||||||||||
| EBITDA | $ | 16,453 | $ | 16,736 | $ | 67,242 | $ | 67,461 | ||||||||
| Year Ended | ||||||||||||||||||||
| December 31, | ||||||||||||||||||||
| EARNINGS BEFORE INTEREST, TAX, DEPRECIATION AND AMORTIZATION FOR REAL ESTATE (EBITDAre) | 2020 | 2019 | ||||||||||||||||||
| Net income attributable to Whitestone REIT | $ | 6,034 | $ | 23,683 | ||||||||||||||||
| Depreciation and amortization | 28,303 | 26,740 | ||||||||||||||||||
| Interest expense | 25,770 | 26,285 | ||||||||||||||||||
| Provision for income taxes | 379 | 400 | ||||||||||||||||||
| Net income attributable to noncontrolling interests | 117 | 545 | ||||||||||||||||||
| Equity in earnings of real estate partnership | (921) | (15,076) | ||||||||||||||||||
| EBITDAre adjustments for real estate partnership | 3,484 | 5,939 | ||||||||||||||||||
| Loss (gain) on sale of property from discontinued operations | — | (594) | ||||||||||||||||||
| Loss (gain) on sale or disposal of assets, net | 364 | (638) | ||||||||||||||||||
| Gain on loan forgiveness | (1,734) | — | ||||||||||||||||||
| EBITDAre | 61,796 | 67,284 | ||||||||||||||||||
| Management fee, net of related expenses | 334 | (42) | ||||||||||||||||||
| Share-based compensation expense | 6,063 | 6,483 | ||||||||||||||||||
| EBITDAre-Adjusted | $ | 68,193 | $ | 73,725 | ||||||||||||||||
EBITDAre: NAREIT defines EBITDAre as net income computed in accordance with GAAP, plus interest expense, income tax expense, depreciation and amortization and impairment write-downs of depreciable property and of investments in unconsolidated affiliates caused by a decrease in value of depreciable property in the affiliate, plus, or minus losses and gains on the disposition of depreciable property, including losses/gains on change in control and adjustments to reflect the entity’s share of EBITDAre of the unconsolidated affiliates and consolidated affiliates with non-controlling interests. The Company calculates EBITDAre in a manner consistent with the NAREIT definition. Management believes that EBITDAre will represent a supplemental non-GAAP performance measure that will provide investors with a relevant basis for comparing REITs. There can be no assurance the EBITDAre as presented by the Company is comparable to similarly titled measures of other REITs. EBITDAre should not should not be considered as alternatives to net income or other measurements under GAAP as indicators of operating performance or to cash flows from operating, investing or financing activities as measures of liquidity. EBITDAre does not reflect working capital changes, cash expenditures for capital improvements or principal payments on indebtedness.
EBITDAre-Adjusted: The Company also presents EBITDAre-Adjusted as an additional supplemental measure as we believe it is reflective of the core operating performance of our portfolio of properties. EBITDAre-Adjusted is defined as NAREIT EBITDAre excluding charges and gains related to non-cash and non-operating transactions and other events that could affect
68
| Three Months Ended | Year Ended | |||||||||||||||
| December 31, | December 31, | |||||||||||||||
| NOI AND SAME STORE NOI | 2019 | 2018 | 2019 | 2018 | ||||||||||||
| Net income attributable to Whitestone REIT | $ | 15,776 | $ | 8,457 | $ | 23,683 | $ | 21,431 | ||||||||
| General and administrative expenses | 5,147 | 5,294 | 21,661 | 23,281 | ||||||||||||
| Depreciation and amortization | 6,875 | 6,635 | 26,740 | 25,679 | ||||||||||||
| Equity in earnings of real estate partnership | (13,596 | ) | (6,669 | ) | (15,076 | ) | (8,431 | ) | ||||||||
| Interest expense | 6,547 | 6,472 | 26,285 | 25,177 | ||||||||||||
| Interest, dividend and other investment income | (109 | ) | (263 | ) | (659 | ) | (1,055 | ) | ||||||||
| Provision for income taxes | 76 | 87 | 400 | 347 | ||||||||||||
| Gain on sale of assets and properties of continuing operations, net | (816 | ) | — | (853 | ) | (4,629 | ) | |||||||||
| Loss (gain) on sale of assets and properties of discontinued operations, net | 107 | — | (594 | ) | — | |||||||||||
| Management fee, net of related expenses | 22 | (59 | ) | (42 | ) | (208 | ) | |||||||||
| Loss (gain) on disposal of assets and properties of continuing operations, net | 63 | (175 | ) | 215 | 82 | |||||||||||
| NOI of real estate partnership (pro rata) | 1,121 | 1,840 | 6,273 | 7,725 | ||||||||||||
| Net income attributable to noncontrolling interests | 360 | 217 | 545 | 550 | ||||||||||||
| NOI | 21,573 | 21,836 | 88,578 | 89,949 | ||||||||||||
Non-Same Store NOI (1) | (267 | ) | (22 | ) | (155 | ) | (487 | ) | ||||||||
| NOI of real estate partnership (pro rata) | (1,121 | ) | (1,840 | ) | (6,273 | ) | (7,725 | ) | ||||||||
| NOI less Non-Same Store NOI and NOI of real estate partnership (pro rata) | 20,185 | 19,974 | 82,150 | 81,737 | ||||||||||||
| Same Store straight line rent adjustments | (192 | ) | (624 | ) | (1,110 | ) | (2,125 | ) | ||||||||
| Same Store amortization of above/below market rents | (72 | ) | (216 | ) | (761 | ) | (1,018 | ) | ||||||||
| Same Store lease termination fees | (176 | ) | (271 | ) | (576 | ) | (729 | ) | ||||||||
Same Store NOI (2) | $ | 19,745 | $ | 18,863 | $ | 79,703 | $ | 77,865 | ||||||||
| Year Ended | ||||||||||||||||||||
| December 31, | ||||||||||||||||||||
| PROPERTY NET OPERATING INCOME | 2020 | 2019 | ||||||||||||||||||
| Net income attributable to Whitestone REIT | $ | 6,034 | $ | 23,683 | ||||||||||||||||
| General and administrative expenses | 21,303 | 21,661 | ||||||||||||||||||
| Depreciation and amortization | 28,303 | 26,740 | ||||||||||||||||||
| Equity in earnings of real estate partnership | (921) | (15,076) | ||||||||||||||||||
| Interest expense | 25,770 | 26,285 | ||||||||||||||||||
| Interest, dividend and other investment income | (278) | (659) | ||||||||||||||||||
| Provision for income taxes | 379 | 400 | ||||||||||||||||||
| Loss (gain) on sale of property from discontinued operations | — | (594) | ||||||||||||||||||
| Management fee, net of related expenses | 334 | (42) | ||||||||||||||||||
| Loss (gain) on sale or disposal of assets, net | 364 | (638) | ||||||||||||||||||
| Gain on loan forgiveness | (1,734) | — | ||||||||||||||||||
| NOI of real estate partnership (pro rata) | 4,232 | 6,273 | ||||||||||||||||||
| Net income attributable to noncontrolling interests | 117 | 545 | ||||||||||||||||||
| NOI | 83,903 | 88,578 | ||||||||||||||||||
Non-Same Store NOI (1) | (1,691) | (155) | ||||||||||||||||||
| NOI of real estate partnership (pro rata) | (4,232) | (6,273) | ||||||||||||||||||
| NOI less Non-Same Store NOI and NOI of real estate partnership (pro rata) | 77,980 | 82,150 | ||||||||||||||||||
| Same Store straight-line rent adjustments | 632 | (1,110) | ||||||||||||||||||
| Same Store amortization of above/below market rents | (787) | (761) | ||||||||||||||||||
| Same Store lease termination fees | (1,613) | (576) | ||||||||||||||||||
Same Store NOI (2) | $ | 76,212 | $ | 79,703 | ||||||||||||||||
(1) We define “Non-Same Store” as properties that have been acquired since the beginning of the period being compared and properties that have been sold, but not classified as discontinued operations. For purposes of comparing the twelve months ended December 31, 2020 to the twelve months ended December 31, 2019, Non-Same Store includes properties acquired between January 1, 2019 and December 31, 2020 and properties sold between January 1, 2019 and December 31, 2020, but not included in discontinued operations.
(2) We define “Same Store” as properties that have been owned during the entire period being compared. For purposes of comparing the twelve months ended December 31, 2020 to the twelve months ended December 31, 2019, Same Store includes properties owned before January 1, 2019 and not sold before December 31, 2020.
NOI: Net Operating Income: Management believes that NOI is a useful measure of the Company's property operating performance. The Company defines NOI as operating revenues (rental and other revenues) less property and related expenses (property operation and maintenance and real estate taxes). Because NOI excludes general and administrative expenses, depreciation and amortization, involuntary conversion, interest expense, interest income, provision for income taxes, gain or loss on sale or disposition of assets, pro rata share of NOI of unconsolidated entities and capital expenditures and leasing costs, it provides a performance measure that, when compared year over year, reflects the revenues and expenses directly associated with owning and operating commercial real estate properties and the impact to operations from trends in occupancy rates, rental
69
rates and operating costs, providing perspective not immediately apparent from net income. The Company uses NOI to evaluate its operating performance since NOI allows the Company to evaluate the impact of factors, such as occupancy levels, lease structure, lease rates and tenant base, have on the Company's results, margins and returns. In addition, management believes that NOI provides useful information to the investment community about the Company's property and operating performance when compared to other REITs since NOI is generally recognized as a standard measure of property performance in the real estate industry. However, NOI should not be viewed as a measure of the Company's overall financial performance since it does not reflect general and administrative expenses, depreciation and amortization, involuntary conversion, interest expense, interest income, provision for income taxes, gain or loss on sale or disposition of assets, and the level of capital expenditures and leasing costs necessary to maintain the operating performance of the Company's properties. Other REITs may use different methodologies for calculating NOI, and accordingly, the Company's NOI may not be comparable to that of other REITs.
Same Store NOI: Management believes that Same Store NOI is a useful measure of the Company’s property operating performance because it includes only the properties that have been owned for the entire period being compared, and that it is used frequently used by the investment community. Same Store NOI assists in eliminating differences in NOI due to the acquisition or disposition of properties during the period being presented, providing a more consistent measure of the Company’s performance. The Company defines Same Store NOI as operating revenues (rental and other revenues, excluding straight linestraight-line rent adjustments, amortization of above/below market rents, and lease termination fees) less property and related expenses (property operation and maintenance
and real estate taxes), Non-Same Store NOI, and NOI of our investment in Pillarstone OP (pro rata). We define “Non-Same Stores” as properties that have been acquired since the beginning of the period being compared and properties that have been sold, but not classified as discontinued operations. Other REITs may use different methodologies for calculating Same Store NOI, and accordingly, the Company's Same Store NOI may not be comparable to that of other REITs.